. 2008 Nov 25;105(47):18126-31.
doi: 10.1073/pnas.0801374105. Epub 2008 Sep 5.

Molecular imaging of proteins in tissues by mass spectrometry

Affiliations

Molecular imaging of proteins in tissues by mass spectrometry

Erin H Seeley et al. Proc Natl Acad Sci U S A. .

Abstract

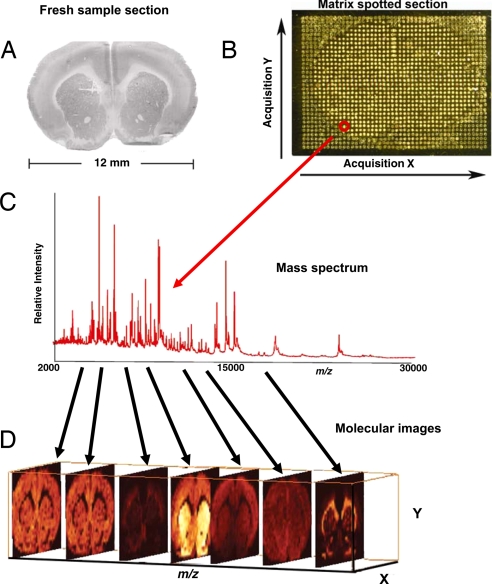
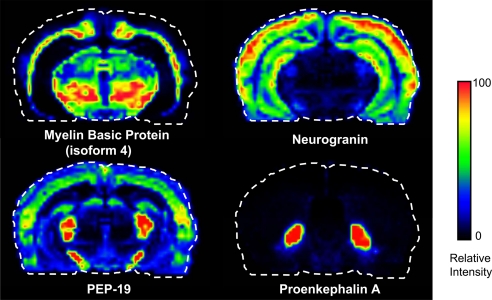
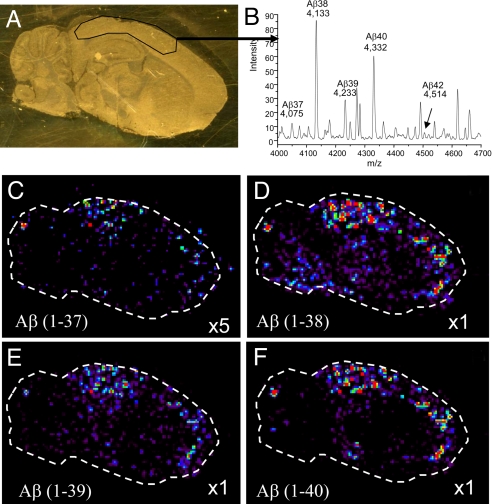
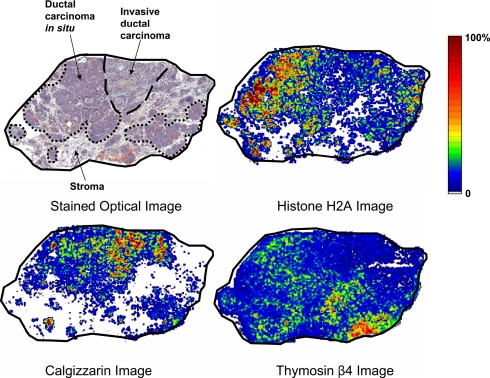
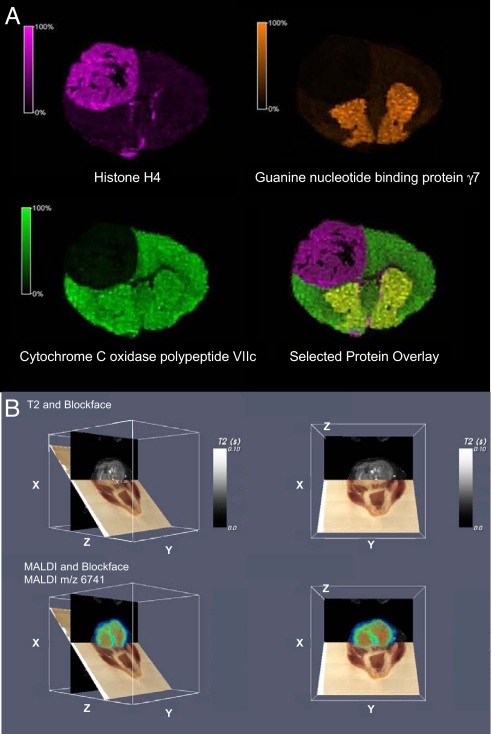
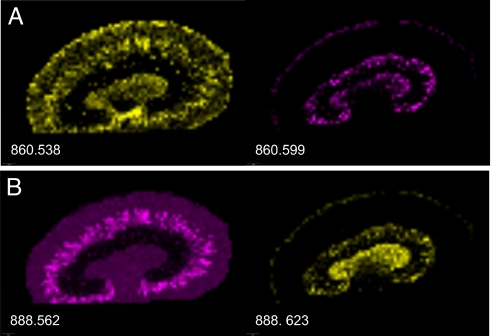
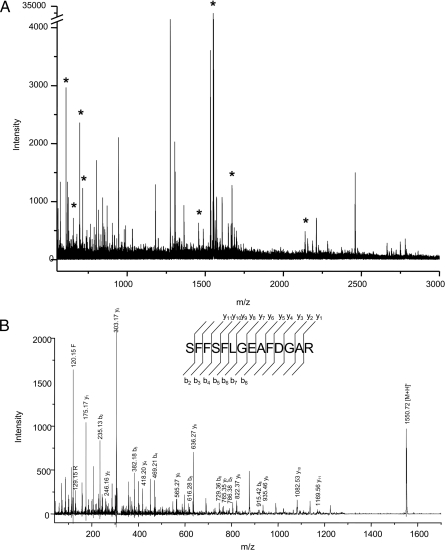
Imaging MS (IMS) is an emerging technology that permits the direct analysis and determination of the distribution of molecules in tissue sections. Biological molecules such as proteins, peptides, lipids, xenobiotics, and metabolites can be analyzed in a high-throughput manner with molecular specificity not readily achievable through other means. Tissues are analyzed intact and thus spatial localization of molecules within a tissue is preserved. Several studies are presented that focus on the unique types of information obtainable by IMS, such as Abeta isoform distributions in Alzheimer's plaques, protein maps in mouse brain, and spatial protein distributions in human breast carcinoma. The analysis of a biopsy taken 100 years ago from a patient with amyloidosis illustrates the use of IMS with formalin-fixed tissues. Finally, the registration and correlation of IMS with MRI is presented.


Conflict of interest statement

The authors declare no conflict of interest.

Figures

Fig. 1.
Fig. 1.
Work flow of an IMS experiment. (A) A tissue section is collected on a conductive MALDI plate. (B) Matrix is deposited in a uniform manner over the surface of the tissue. (C) Spectra are acquired from each location (pixel) over the surface of the tissue. (D) 2D ion density images are reconstructed from the spectra. Hundreds of protein images can be created from a single 12-μm-thick section of tissue from a single acquisition.
Fig. 2.
Fig. 2.
Coronal rat brain images of four different proteins showing very different distributions throughout the brain. These images were constructed from a dataset obtained from pixels (matrix spots) of ≈180 μm in diameter located in an ordered array 200 μm apart (center to center).
Fig. 3.
Fig. 3.
IMS allows for distinction of different molecular species of β-amyloid plaques in an Alzheimer's disease model. (A) Optical image of the mouse brain tissue section on a gold-coated MALDI target. Enclosed area is a region of high concentration of β-amyloid plaques. (B) Average spectrum from the selected region of the tissue from A. (C–F) Ion density images of four different truncations of the β-amyloid protein.
Fig. 4.
Fig. 4.
H&E-stained section and mass spectral images of a human breast carcinoma section. The stained section shows areas of invasive ductal carcinoma, ductal carcinoma in situ (DCIS), and stroma. Histone H2A shows the highest abundance in DCIS, calgizzarin in the invasive carcinoma region, and thymosin β4 in stroma.
Fig. 5.
Fig. 5.
Mouse brain tumor images. (A) Mouse model of human glioma showing proteins that localize to the tumor (histone H4), to the striatum (guanine nucleotide binding protein γ7), and one that is uniformly distributed throughout the normal brain tissue (cytochrome c oxidase polypeptide VIIc). (B) Coregistered block face optical images (brown plane), MRI data (black plane), and protein images (colored plane) from a mouse head with a tumor. Four angles of intersection of the MRI, optical, and MS planes are shown.
Fig. 6.
Fig. 6.
FT-ICR imaging of a mouse kidney. Two examples (A and B) are shown of lipid species of the same nominal mass, but that display very different spatial distributions. The 0.06-Da mass difference between these species is easily resolved in MALDI-FT-ICR.
Fig. 7.
Fig. 7.
Direct analysis of a human spleen sample collected in 1899 and stored in formaldehyde. (A) MS spectrum of tryptic peptides obtained from in situ digestion of a tissue section. Serum amyloid A peptides are indicated by *. (B) MS/MS spectrum of the peptide of m/z 1550.7. Database searching identified this peptide and many others as being from serum amyloid A.

Similar articles

Cited by

References

    1. McDonnell LA, Heeren RMA. Imaging mass spectrometry. Mass Spectrom Rev. 2007;26:606–643. - PubMed
    1. Pacholski ML, Winograd N. Imaging with mass spectrometry. Chem Rev. 1999;99:2977–3005. - PubMed
    1. Hillenkamp F, Karas M, Beavis RC, Chait BT. Matrix-assisted laser desorption ionization mass spectrometry of biopolymers. Anal Chem. 1991;63:A1193–A1202. - PubMed
    1. Chaurand P, Hayn G, Matter U, Caprioli RM. Exploring the potential of cryodetectors for the detection of matrix-assisted laser desorption/ionization produced ions: Application to profiling and imaging mass spectrometry. Zhipu Xuebao. 2004;25:205–206. 215.
    1. Sugiura Y, Shimma S, Setou M. Thin sectioning improves the peak intensity and signal-to-noise ratio in direct tissue mass spectrometry. J Mass Spectrom Soc Jpn. 2006;54:45–48.

Publication types

MeSH terms

LinkOut - more resources