. 2008 Sep 16;105(37):14198-203.
doi: 10.1073/pnas.0806558105. Epub 2008 Sep 5.

The guanylate kinase domain of the beta-subunit of voltage-gated calcium channels suffices to modulate gating

Affiliations

The guanylate kinase domain of the beta-subunit of voltage-gated calcium channels suffices to modulate gating

Giovanni Gonzalez-Gutierrez et al. Proc Natl Acad Sci U S A. .

Abstract

Inactivation of voltage-gated calcium channels is crucial for the spatiotemporal coordination of calcium signals and prevention of toxic calcium buildup. Only one member of the highly conserved family of calcium channel beta-subunits--Ca(V)beta--inhibits inactivation. This unique property has been attributed to short variable regions of the protein; however, here we report that this inhibition actually is conferred by a conserved guanylate kinase (GK) domain and, moreover, that this domain alone recapitulates Ca(V)beta-mediated modulation of channel activation. We expressed and refolded the GK domain of Ca(V)beta(2a), the unique variant that inhibits inactivation, and of Ca(V)beta(1b), an isoform that facilitates it. The refolded domains of both Ca(V)beta variants were found to inhibit inactivation of Ca(V)2.3 channels expressed in Xenopus laevis oocytes. These findings suggest that the GK domain endows calcium channels with a brake restraining voltage-dependent inactivation, and thus facilitation of inactivation by full-length Ca(V)beta requires additional structural determinants to antagonize the GK effect. We found that Ca(V)beta can switch the inactivation phenotype conferred to Ca(V)2.3 from slow to fast after posttranslational modifications during channel biogenesis. Our findings provide a framework within which to understand the modulation of inactivation and a new functional map of Ca(V)beta in which the GK domain regulates channel gating and the other conserved domain (Src homology 3) may couple calcium channels to other signaling pathways.


Conflict of interest statement

The authors declare no conflict of interest.

Figures

Fig. 1.
Fig. 1.
Domain structure, purification, and binding assay of CaVβ constructs. (A) Schematic representation of CaVβ2a, CaVβ1b, and derived protein constructs used in this study. CaVβ consists of two highly conserved regions, D1 and D2 (boxes), which are connected and flanked by variable regions (continuous lines). The gray box is the SH3 module; the black box is the GK module. The two cysteine residues at the N terminus of CaVβ2a that undergo palmitoylation are indicated by arrows. (B) A ribbon diagram of the crystal structure of CaVβ in complex with AID (PDB accession code 1T3L). (C) Size-exclusion chromatography elution profile on the Superdex 200 10/30 column (GE Healthcare) of refolded CaVβ2a-GK and CaVβ1b-GK. Here 1 indicates the void volume, 2 indicates the elution volume of albumin (67 kDa), and 3 indicates the elution volume of ovalbumin (43 kDa). The inset shows Coomassie-stained sodium dodecyl sulfate polyacrylamide gel electrophoresis (SDS/PAGE) gels of the indicated proteins. Numbers indicate the molecular mass of standards, in kDa. (D) SDS/PAGE gel of the binding reaction with the indicated proteins. Yellow fluorescence protein (YFP)-CaVβ2a-GK is seen to bind specifically to GST–loop I-II (last lane). The binding assay was repeated three times.
Fig. 2.
Fig. 2.
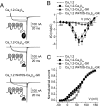
Refolded CaVβ2a-GK and CaVβ2a-SH3-GK shift the current–voltage relationship of CaV1.2-mediated currents. (A) Representative gating and ionic currents traces from oocytes expressing CaV1.2 cRNA alone and after injection of either CaVβ2a-SH3-GK or CaVβ2a-GK. Currents were evoked by 50-ms pulses to −30, 0, and +30 mV from a holding potential of −80 mV. (B) Normalized current–voltage plot from oocytes expressing the subunit combinations CaV1.2 cRNA (n = 11), CaV1.2 + CaVβ2a-SH3-GK (n = 14), and CaV1.2 + CaVβ2a-GK (n = 16). For comparison, normalized current–voltage curves for CaV1.2 + CaVβ2a, either injected as a protein (dashed line) or co-injected as cRNA (continuous line) are shown (see Table S1 for details).
Fig. 3.
Fig. 3.
CaVβ2a-GK covalently linked to CaV1.2 WT, but not to CaV1.2 W470S, increases peak current amplitudes and shifts the current–voltage relationship. (A) Representative gating and ionic current traces from oocytes expressing CaV1.2 WT covalently linked to either CaVβ2a (CaV1.2-CaVβ2a) or CaVβ2a-GK (CaV1.2-CaVβ2a-GK), and CaV1.2 W470S covalently linked to CaVβ2a-GK (CaV1.2 W470S-CaVβ2a-GK). Currents were evoked by 50-ms pulses to −30, 0, and +30 mV from a holding potential of −80 mV. (B) Ionic current from oocytes expressing the different constructs were normalized by charge movement (I/Q) and plotted versus voltage. For CaV1.2-CaVβ2a, the peak I/Q was 2.44 ± 0.44 nA/pC (n = 17); for CaV1.2-CaVβ2a-GK, it was 2.71 ± 0.52 nA/pC (n = 17); and for CaV1.2 W470S-CaVβ2a-GK, it was 0.35 ± 0.03 nA/pC (n = 17). For comparison, the average I/Q from 15 oocytes expressing CaV1.2 alone are shown as dashed lines (0.30 ± 0.06 nA/pC). (C) Normalized tail currents from oocytes expressing the different constructs. The continuous lines correspond to the fit of the sum of two Boltzmann distributions, and the dashed line corresponds to the fit obtained from CaV1.2-expressing oocytes (see Fig. S4 and Table S1 for details). The fit to CaV1.2 W470S-CaVβ2a-GK was excluded from the plot for clarity.
Fig. 4.
Fig. 4.
CaVβ-GK slows inactivation of CaV2.3-mediated currents. (A) Representative current traces from oocytes expressing CaV2.3 cRNA alone or after injection of the specified protein during a 10-s pulse to 0 mV from a holding potential of −90 mV. (B) Average decay times to half-peak current amplitude (t½) for the different subunit combinations: CaV2.3 cRNA, t½ = 0.33 ± 0.03 s (n = 26); CaV2.3 + CaVβ2a-GK cRNA, t½ = 0.41 ± 0.05 s (n = 13); CaV2.3 + CaVβ2a-GK, t½ = 1.85 ± 0.44 s (n = 13); CaV2.3 + CaVβ2a-SH3-GK, t½ = 3.57 ± 0.42 s (n = 21); CaV2.3 + CaVβ2a cRNA, t½ = 4.11 ± 0.65 s (n = 12); CaV2.3 + CaVβ2a, t½ = 4.76 ± 0.70 s (n = 16); CaV2.3 + CaVβ2a-SH3, t½ = 0.35 ± 0.04 s (n = 13). The t½ values for CaV2.3 + CaVβ2a-GK, CaV2.3 + CaVβ2a-SH3-GK, and CaV2.3 + CaVβ2a were significantly different from those measured in oocytes expressing CaV2.3 alone (t test; P < .01). (C) Time course of inhibition of inactivation by CaVβ2a-GK. Each bar corresponds to the average t½ measured at different time intervals after protein injection. The first bar includes recordings from 12–50 min (n = 4), and the second bar includes recordings from 51–100 min (n = 6) and every 100 min thereafter (n = 7, 2, and 4, respectively). The dashed line corresponds to t½ for CaV2.3 alone.
Fig. 5.
Fig. 5.
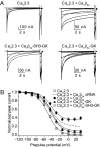
CaVβ-GK shifts midpoint voltage for the steady-state inactivation of CaV2.3-mediated currents. (A) Representative traces of CaV2.3-mediated currents in the presence of the specified protein during a steady-state inactivation pulse protocol. This consisted of a 10-s conditioning period to voltages of increasing amplitude, from −120 mV to +30 mV in 15-mV increments, followed by a 0.4-s test pulse to 0 mV. Pulses were delivered once every 50 s from a holding potential of −90 mV. (B) Average steady-state inactivation curves from oocytes expressing CaV2.3 alone (n = 22) or after injection of full-length CaVβ2a (n = 13), CaVβ2a-SH3-GK (n = 23), or CaVβ2a-GK (n = 15). The continuous lines correspond to Boltzmann distributions plus a noninactivating current component that best described each set of data. For comparison, the Boltzmann distributions that best described the CaV2.3 + CaVβ2a cRNA data (dashed line) also are shown. The V½ values for CaV2.3 + CaVβ2a-GK and CaV2.3 + CaVβ2a-SH3-GK are significantly different than the V½ measured in oocytes expressing CaV2.3 alone (t test; P < .01) (see Table S2 for details).
Fig. 6.
Fig. 6.
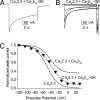
CaVβ1b-GK slows inactivation of CaV2.3-mediated currents and shifts the steady-state inactivation toward more depolarized potentials. (A) Representative current traces from a CaV2.3-expressing oocytes injected with CaVβ1b-GK during a 10-s pulse to 0 mV from a holding potential of −90 mV. (B) Current traces evoked with the steady-state inactivation pulse protocol from the same oocytes shown in (A). (C) Average steady-state inactivation curve from oocytes expressing CaV2.3 and injected with CaVβ1b-GK protein (n = 14). For comparison, the Boltzmann distributions that best describe CaV2.3 and CaV2.3 + CaVβ2a data from Fig. 5 also are shown (dashed lines). The V½ value for CaV2.3 + CaVβ1b-GK was significantly different from that measured in oocytes expressing CaV2.3 alone (t test; P < .01) (see Table S2 for details).
Fig. 7.
Fig. 7.
The CaV2.3-inactivation phenotype induced by full-length CaVβ1b and CaVβ2aC3,4S depends on the time of injection. (A) Representative current traces from oocytes expressing CaV2.3 channels with CaVβ1b or CaVβ2aC3,4S injected either 2–7 h before recording (late injection) or co-injected with CaV2.3-encoding cRNA (co-injection). Currents were evoked by a 10-s pulse to 0 mV from a holding potential of −90 mV. (B) Average t½ for both of the subunit combinations shown in (A). Using CaVβ1b, the t½ values for co-injection (0.29 ± 0.02 s; n = 11) and late injection (2.19 ± 0.25 s; n = 14) differed significantly. This was true for experiments with CaVβ2aC3,4S as well (co-injection: 0.82 ± 0.08 s, n = 13; late injection: 2.86 ± 0.48 s, n = 16; t test; P < .01). (C) Steady-state inactivation curves from oocytes either co-injected or late-injected with CaVβ1b. The continuous lines correspond to the Boltzmann distributions that best describe each set of data. For comparison, the Boltzmann distributions that best describe the CaV2.3 data from Fig. 5 are shown (dashed lines). (D) As in C, but for CaVβ2aC3,4S. With both proteins, the V½ values from the co-injection experiments were significantly more negative than those from the late-injection experiments (t test; P < .01). For CaVβ2a C3,4S, the V½ values from both the late-injection and co-injection experiments were significantly different from those values for CaV2.3 alone (t test; P < .01). The V½ value for CaVβ1b differed from that of CaV2.3 alone only in the co-injection experiments. With both proteins, t½ values in late-injection and co-injection experiments differed significantly from each other and from those values for CaV2.3 alone (t test; P < .01) (see Table S2 for details).

Similar articles

Cited by

References

    1. Catterall WA. Structure and regulation of voltage-gated Ca2+ channels. Annu Rev Cell Dev Biol. 2000;16:521–555. - PubMed
    1. Pragnell M, et al. Calcium channel β-subunit binds to a conserved motif in the I-II cytoplasmic linker of the α1-subunit. Nature. 1994;368:67–70. - PubMed
    1. Harry JB, Kobrinsky E, Abernethy DR, Soldatov NM. New short splice variants of the human cardiac Cavbeta2 subunit: Redefining the major functional motifs implemented in modulation of the Cav1.2 channel. J Biol Chem. 2004;279:46367–46372. - PubMed
    1. Opatowsky Y, Chen CC, Campbell KP, Hirsch JA. Structural analysis of the voltage-dependent calcium channel beta subunit functional core and its complex with the alpha 1 interaction domain. Neuron. 2004;42:387–399. - PubMed
    1. Chen YH, et al. Structural basis of the alpha1-beta subunit interaction of voltage-gated Ca2+ channels. Nature. 2004;429:675–680. - PubMed

Publication types

MeSH terms

LinkOut - more resources