. 2009 Mar;40(3):295-304.
doi: 10.1165/rcmb.2008-0170OC. Epub 2008 Sep 5.

Macrophages directly contribute to the exaggerated inflammatory response in cystic fibrosis transmembrane conductance regulator-/- mice

Affiliations

Macrophages directly contribute to the exaggerated inflammatory response in cystic fibrosis transmembrane conductance regulator-/- mice

Emanuela M Bruscia et al. Am J Respir Cell Mol Biol. 2009 Mar.

Erratum in

  • Am J Respir Cell Mol Biol. 2012 Apr;46(4):561

Abstract

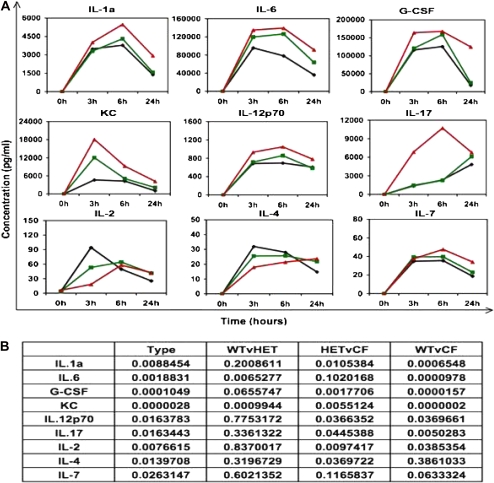
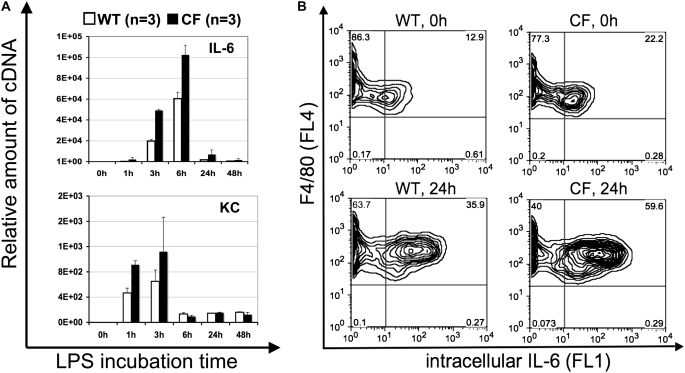
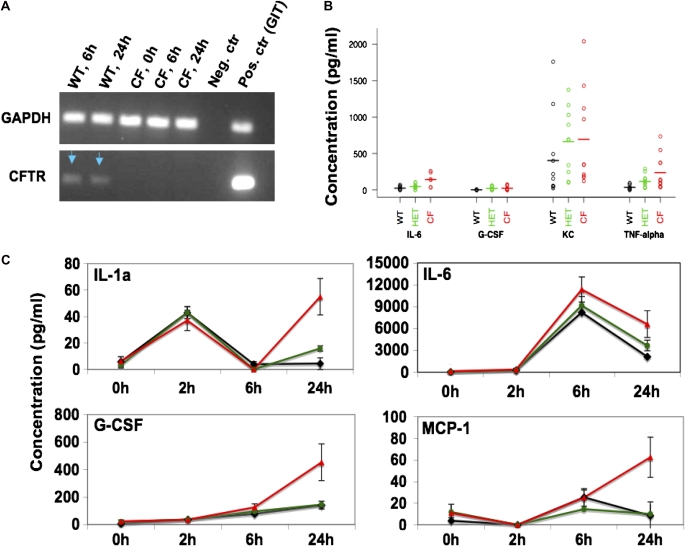
Pulmonary infection with an exaggerated inflammatory response is the major cause of morbidity and mortality in cystic fibrosis (CF). The objective of this study was to determine whether differences in the innate immune system underlie the exaggerated immune response in CF. We established a model that recapitulates the exaggerated immune response in a CF mouse model by exposure to Pseudomonas aeruginosa LPS and assessed the pulmonary cellular and cytokine responses of wild-type (WT) and CF mice. Compared with WT mice, CF mice had increased numbers of neutrophils and increased proinflammatory cytokines in their bronchoalveolar lavage fluid after LPS exposure. Based on the increased levels of IL-1alpha, IL-6, granulocyte colony-stimulating factor (G-CSF), and keratinocyte chemoattractant, all of which are known to be produced by macrophages, we tested whether two populations of macrophages, bone marrow-derived macrophages and alveolar macrophages, directly contribute to the elevated cytokine response of CF mice to LPS. After in vitro stimulation of bone marrow-derived macrophages and alveolar macrophages with LPS, IL-1alpha, IL-6, G-CSF, and monocyte chemoattractant protein-1 were higher in CF compared with WT cell supernatants. Quantitative analyses for IL-6 and keratinocyte chemoattractant revealed that LPS-stimulated CF macrophages have higher mRNA and intracellular protein levels compared with WT macrophages. Our data support the hypothesis that macrophages play a role in the exuberant cytokine production and secretion that characterizes CF, suggesting that the macrophage response may be an important therapeutic target for decreasing the morbidity of CF lung disease.


Figures

<b>Figure 1.</b>
Figure 1.
Cystic fibrosis (CF) and HET mice treated with LPS have higher numbers of cells in the BAL. (A) Total and differential cell counting in the bronchoalveolar lavage (BAL) fluid of control (0 h) and LPS-treated (3, 6, and 24 h) wild-type (WT) (black), HET (green), and CF (red) mice. Note different scales for neutrophils and macrophages. (B) H&E staining of lung tissues, confirming that the clearance of neutrophils in the lung of CF mice is slower than in WT mice. (C) Top: ratio of T (CD3+) to B (B220+) lymphocyte; bottom: ratio of CD8 to CD4 lymphocytes, as assessed by flow cytometry of whole-lung digests. Line segments denote means (calculated on the log scale).
<b>Figure 2.</b>
Figure 2.
Comparison of BAL cytokine concentrations in LPS-treated WT, HET, and CF mice. (A) BAL cytokine concentration before (0 h) and after (3, 6, 24 h) LPS treatment in WT (black), HET (green), and CF (red) mice. The cytokines represented here show notable differences between WT and CF. Cytokines that did not exhibit significant differences between WT and CF are shown in Figure E2. (B) P values for the paired genotype comparisons for the nine cytokines represented in (A). The first column of P values (Type) shows the statistical significance of the genotypes in the ANOVA. The other columns of P values show the subsequent paired comparisons between WT and HET (WTvHET), HET and CF (HETvCF). and WT and CF (WTvCF).
<b>Figure 3.</b>
Figure 3.
Kinetics of cytokine secretion by bone marrow (BM)–derived macrophages (BMDM) after LPS stimulation. (A) Supernatants from BMDM from WT (black), HET (green), and CF (red) mice (n = 6 mice for each genotype) were analyzed before (0 h) and after (3, 6, 24, and 48 h) stimulation with LPS for the cytokine concentration (pg/ml) by Luminex. The concentration of each cytokine was normalized to 1 × 10⁶ BMDC. The plots represent means of cytokine secretions for the six cytokines showing the most robust differences between WT and CF. Note that for G-CSF, only the 3 and 6 hours time points are graphed. At 0 hours G-CSF was not detected and at 24 and 48 hours G-CSF concentration was much higher than 3 and 6 hours, but showed no differences between the genotypes. (B) P values from one-sided, two-sample t tests (unequal variances) and Wilcoxon rank-sum tests for the cytokine concentrations in the supernatant of WT, HET, and CF BMDMs cultured in the absence (0 h) or presence of LPS. Values less than 0.05 are in boldface.
<b>Figure 4.</b>
Figure 4.
mRNA and intracellular protein quantification of IL-6 and KC. (A) The relative amount of specific mRNA expression in macrophages was determined by quantitative RT-PCR using a standard curve method. The copy number of IL-6 mRNA (top) and KC mRNA (bottom) was normalized to a ubiquitously expressed mRNA (18S) level. The data are expressed as the mRNA expression at different time points after LPS treatment, normalized to mRNA expression in untreated cells. The data represent the average of two independent experiments and two RT-PCR repeats for WT (open bars) and CF (closed bars). (B) Intracellular staining for IL-6 before (0 h) and after (24 h) LPS treatment. Error bars: standard error of the mean (SEM).
<b>Figure 5.</b>
Figure 5.
Alveolar macrophage (AM) characterization. (A) RT-PCR for GAPDH (upper panel) and CF transmembrane conductance regulator (CFTR) (lower panel) from mRNA inverted transcribed in cDNA with random primers and amplified with GAPDH- and CFTR-specific primers. Positive control (Pos. ctr): cDNA from WT gastrointestinal tract (GIT). (B) Cytokine concentration in the supernatant of WT (black), HET (green), and CF (red) untreated AM. G-CSF and IL-6 were higher in CF compared with WT (based on t tests and nonparametric tests of log-transformed data; P < 0.05). (C) Mean cytokine concentration after treatment with LPS for different times (2, 6, and 24 h). Concentration (pg/ml) was normalized to 1 × 10⁵. Each of these cytokines showed robust differences between WT and CF at 24 hours (based on t tests and nonparametric tests of log-transformed data; P < 0.05). Error bars: standard error of the mean (SEM).
<b>Figure 6.</b>
Figure 6.
Cytokine concentrations in the BAL of transplanted animals after LPS stimulation. BAL cytokine concentrations 6 hours after LPS treatment in WT into WT (W-W), WT into CF (W-C), CF into WT (C-W), and CF into CF (C-C) mice. (A) Nine cytokines, the concentrations of which appear to be dependent on BM genotype. Concentrations of IL-6, IL-17, IL-15, INF-γ, KC, G-CSF, TNF-α, and regulated upon activation, normal T-cell expressed and secreted (RANTES) were significantly different in C-C versus W-C groups and W-W versus C-W (P < 0.05). (B) Three cytokines that appear to be dependent on epithelial (host) genotype. Concentration of IL-1β was significantly different in C-W versus C-C and the W-W versus W-C (P < 0.05). Y axes = concentration (pg/ml). Error bars: standard error of the mean (SEM).

References

    1. Rowe SM, Miller S, Sorscher EJ. Cystic fibrosis. N Engl J Med 2005;352:1992–2001. - PubMed
    1. Haggie PM, Verkman AS. Cystic fibrosis transmembrane conductance regulator-independent phagosomal acidification in macrophages. J Biol Chem 2007;282:31422–31428. - PubMed
    1. Di A, Brown ME, Deriy LV, Li C, Szeto FL, Chen Y, Huang P, Tong J, Naren AP, Bindokas V, et al. CFTR regulates phagosome acidification in macrophages and alters bactericidal activity. Nat Cell Biol 2006;8:933–944. - PubMed
    1. Painter RG, Valentine VG, Lanson NA Jr, Leidal K, Zhang Q, Lombard G, Thompson C, Viswanathan A, Nauseef WM, Wang G, et al. CFTR expression in human neutrophils and the phagolysosomal chlorination defect in cystic fibrosis. Biochemistry 2006;45:10260–10269. - PMC - PubMed
    1. Painter RG, Bonvillain RW, Valentine VG, Lombard GA, LaPlace SG, Nauseef WM, Wang G. The role of chloride anion and CFTR in killing of Pseudomonas aeruginosa by normal and CF neutrophils. J Leukoc Biol 2008;83:1345–1353. - PMC - PubMed

Publication types

MeSH terms

Substances