. 2008 Dec;57(12):3273-80.
doi: 10.2337/db08-0767. Epub 2008 Sep 5.

Idd9/11 genetic locus regulates diabetogenic activity of CD4 T-cells in nonobese diabetic (NOD) mice

Affiliations

Idd9/11 genetic locus regulates diabetogenic activity of CD4 T-cells in nonobese diabetic (NOD) mice

Yi-Guang Chen et al. Diabetes. 2008 Dec.

Abstract

Objective: Although the H2(g7) major histocompatibility complex (MHC) provides the primary pathogenic component, the development of T-cell-mediated autoimmune type 1 diabetes in NOD mice also requires contributions from other susceptibility (Idd) genes. Despite sharing the H2(g7) MHC, the closely NOD-related NOR strain remains type 1 diabetes resistant because of contributions of protective Idd5.2, Idd9/11, and Idd13 region alleles. To aid their eventual identification, we evaluated cell types in which non-MHC Idd resistance genes in NOR mice exert disease-protective effects.

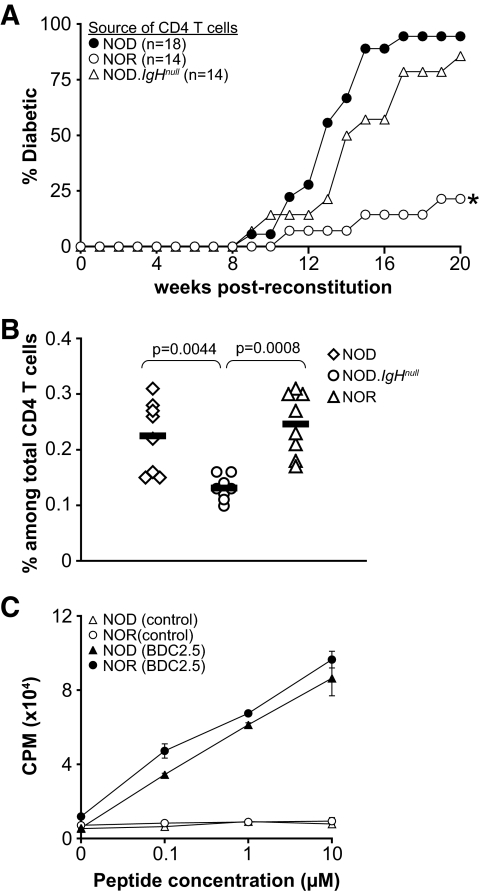
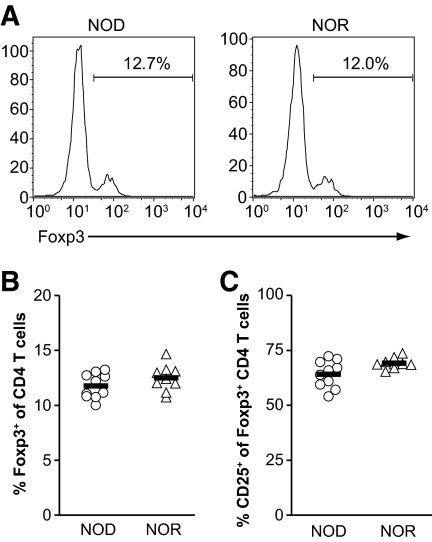
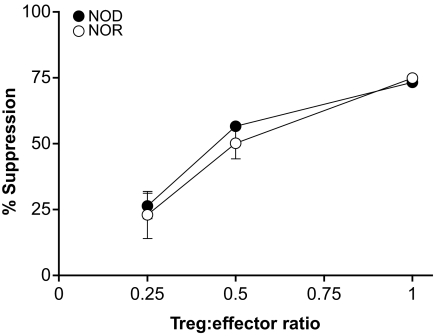
Research design and methods: Adoptive transfer and bone marrow chimerism approaches tested the diabetogenic activity of CD4 and CD8 T-cells from NOR mice and NOD stocks congenic for NOR-derived Idd resistance loci. Tetramer staining and mimotope stimulation tested the frequency and proliferative capacity of CD4 BDC2.5-like cells. Regulatory T-cells (Tregs) were identified by Foxp3 staining and functionally assessed by in vitro suppression assays.

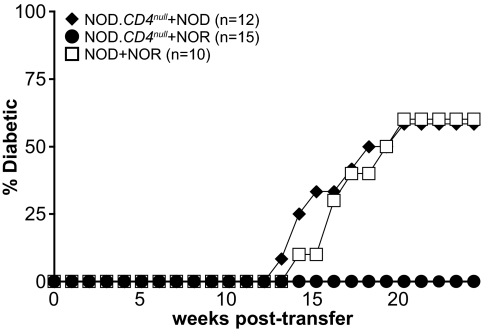
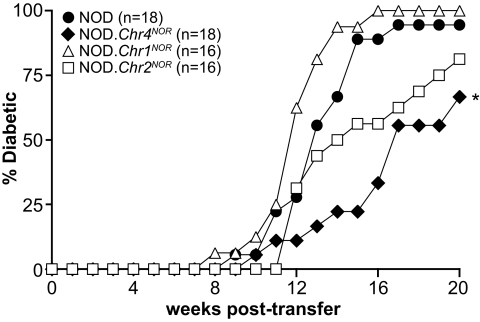
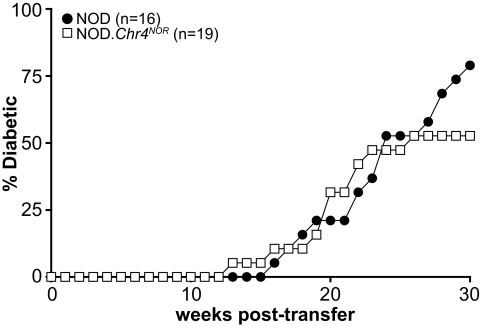
Results: NOR CD4 T-cells were less diabetogenic than those from NOD mice. The failure of NOR CD4 T-cells to induce type 1 diabetes was not due to decreased proliferative capacity of BDC2.5 clonotypic-like cells. The frequency and function of Tregs in NOD and NOR mice were also equivalent. However, bone marrow chimerism experiments demonstrated that intrinsic factors inhibited the pathogenic activity of NOR CD4 T-cells. The NOR Idd9/11 resistance region on chromosome 4 was found to diminish the diabetogenic activity of CD4 but not CD8 T-cells.

Conclusions: In conclusion, we demonstrated that a gene(s) within the Idd9/11 region regulates the diabetogenic activity of CD4 T-cells.


Figures

FIG. 1.
FIG. 1.
Reduced diabetogenic activity of NOR CD4 T-cells. A: Incidence of type 1 diabetes in CD4 T-cell–reconstituted NOD.CD4null mice. Lethally irradiated 4- to 7-week-old NOD.CD4null mice were injected with equal numbers (5 × 10⁶) of syngeneic bone marrow and purified CD4 T-cells from NOD, NOR, or NOD.IgHnull donors. Type 1 diabetes development was then followed for 20 weeks. *P < 0.001, significantly different from NOD CD4 T-cell recipients (Kaplan-Meier log-rank analysis). B: The frequency of BDC2.5-like diabetogenic CD4 T-cells in NOD, NOR, or NOD.IgHnull mice. Splenocytes from 6- to 9-week-old females were stained with CD4 antibodies and BDC2.5 MHC class II tetramers to identify BDC2.5-like cells. Each symbol represents an individual mouse. Horizontal bars indicate the means. The percentages of BDC2.5-like cells did not differ in NOD and NOR mice but were both significantly greater than in the NOD.IgHnull strain (Wilcoxon's rank-sum test). C: Functional analysis of BDC2.5-like cells in NOD and NOR mice. Groups of three mice were primed with 20 μg BDC2.5 mimotope or IAg7-binding control peptide in IFA. After 10 days, cells from the draining lymph nodes of the same group were pooled, and all were restimulated in triplicate with indicated concentration of the BDC2.5 mimotope. The cultures were pulsed with [3H]thymidine over the final 20 h of a 72-h incubation period. Results indicate the mean counts per minute (CPM) ± SE of the triplicates.
FIG. 2.
FIG. 2.
Comparison of Treg frequencies in NOD and NOR mice. Splenocytes from 6- to 9-week-old mice were stained with antibodies against CD4, Foxp3, and CD25 to identify Tregs. A: Representative plots show the proportion of Foxp3-expressing CD4 T-cells. B: The percentages of CD4 T-cells expressing Foxp3. C: The percentages of CD25+ cells among Foxp3+ CD4 T-cells. Each symbol represents an individual mouse. Horizontal bars indicate the means. There is no statistically significant difference in the percentages shown in B and C between NOD and NOR mice (Wilcoxon's rank-sum test).
FIG. 3.
FIG. 3.
Comparison of in vitro suppressive activities of NOD and NOR Tregs. Effector T-cells (CD4+CD25) were labeled with CFSE and cocultured at indicated ratios with Tregs (CD4+CD25+) in triplicate in a 96-well plate in the presence of NOD.scid splenocytes (2 × 10⁵) and 5 μg/ml anti-CD3 for 3 days. Proliferation of effector T-cells was determined by CFSE dilution. The percentage of suppression is defined by the percent reduction in the proportion of divided effector T-cells relative to that of the control without Tregs. Results indicate the means ± SE of the triplicates. Similar results were observed in another two experiments.
FIG. 4.
FIG. 4.
Intrinsic factors control the diabetogenic activity of NOR CD4 T-cells. Lethally irradiated NOD.CD4null mice were reconstituted with a mixture of syngeneic bone marrow with NOD or NOR bone marrow at a 4:1 ratio. A control group was reconstituted with a 4:1 mixture of NOD and NOR bone marrow. Type 1 diabetes development was then analyzed weekly.
FIG. 5.
FIG. 5.
The diabetogenic activity of CD4 T-cells is regulated by a gene(s) within the Idd9/Idd11 region. CD4 T-cells (5 × 10⁶) purified from NOD.Chr1NOR, NOD.Chr2NOR, or NOD.Chr4NOR mice and NOD.CD4null bone marrow cells (5 × 10⁶) were mixed and injected into lethally irradiated 4- to 7-week-old NOD.CD4null recipients. Type 1 diabetes development was then followed weekly for 20 weeks. The same accumulated incidence of NOD CD4 T-cell recipients shown in Fig. 1A was also plotted here for comparative purposes. All CD4 T-cell transfer experiments, including those shown in Fig. 1A, were done in an overlapping fashion. *P < 0.001, significantly different from NOD CD4 T-cell recipients (Kaplan-Meier log-rank analysis).
FIG. 6.
FIG. 6.
The diabetogenic activity of NOD and NOD.CD4null CD8 T-cells is comparable. Lethally irradiated NOD.CD8null mice were injected with 5 × 10⁶ syngeneic bone marrow cells and 5 × 10⁶ CD8 T-cells purified from NOD mice or the NOD.Chr4NOR congenic strain. Type 1 diabetes development was then analyzed weekly. The type 1 diabetes incidence between NOD and NOD.Chr4NOR CD8 T-cell recipient groups is not significantly different (Kaplan-Meier log-rank analysis).

References

    1. Serreze DV, Leiter EH: Genes and cellular requirements for autoimmune diabetes susceptibility in nonobese diabetic mice. Curr Dir Autoimmun 4 :31 –67,2001 - PubMed
    1. Anderson MS, Bluestone JA: The NOD mouse: a model of immune dysregulation. Annu Rev Immunol 23 :447 –485,2005 - PubMed
    1. DiLorenzo TP, Serreze DV: The good turned ugly: immunopathogenic basis for diabetogenic CD8+ T cells in NOD mice. Immunol Rev 204 :250 –263,2005 - PubMed
    1. Hamilton-Williams EE, Serreze DV, Charlton B, Johnson EA, Marron MP, Mullbacher A, Slattery RM: Transgenic rescue implicates beta2-microglobulin as a diabetes susceptibility gene in nonobese diabetic (NOD) mice. Proc Natl Acad Sci U S A 98 :11533 –11538,2001 - PMC - PubMed
    1. Vijayakrishnan L, Slavik JM, Illes Z, Greenwald RJ, Rainbow D, Greve B, Peterson LB, Hafler DA, Freeman GJ, Sharpe AH, Wicker LS, Kuchroo VK: An autoimmune disease-associated CTLA-4 splice variant lacking the B7 binding domain signals negatively in T cells. Immunity 20 :563 –575,2004 - PubMed

Publication types

MeSH terms

Substances