. 2008 Dec;57(12):3189-98.
doi: 10.2337/db08-0645. Epub 2008 Sep 5.

Lymphocytes from patients with type 1 diabetes display a distinct profile of chromatin histone H3 lysine 9 dimethylation: an epigenetic study in diabetes

Affiliations

Lymphocytes from patients with type 1 diabetes display a distinct profile of chromatin histone H3 lysine 9 dimethylation: an epigenetic study in diabetes

Feng Miao et al. Diabetes. 2008 Dec.

Abstract

Objective: The complexity of interactions between genes and the environment is a major challenge for type 1 diabetes studies. Nuclear chromatin is the interface between genetics and environment and the principal carrier of epigenetic information. Because histone tail modifications in chromatin are linked to gene transcription, we hypothesized that histone methylation patterns in cells from type 1 diabetic patients can provide novel epigenetic insights into type 1 diabetes and its complications.

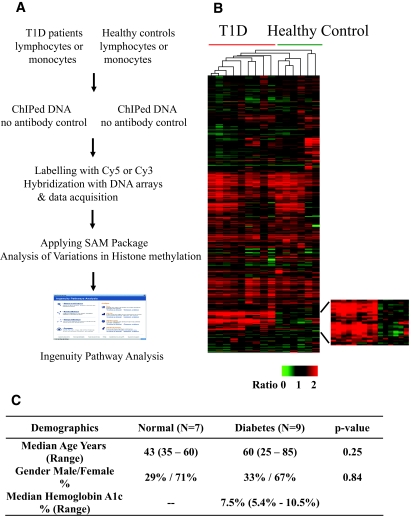
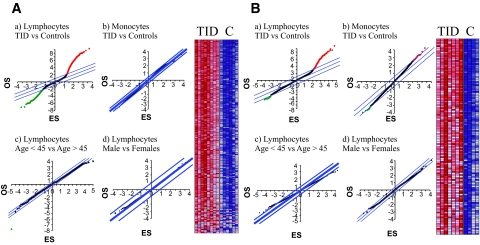
Research design and methods: We used chromatin immunoprecipitation (ChIP) linked to microarray (ChIP-chip) approach to compare genome-wide histone H3 lysine 9 dimethylation (H3K9me2) patterns in blood lymphocytes and monocytes from type 1 diabetic patients versus healthy control subjects. Bioinformatics evaluation of methylated candidates was performed by Ingenuity Pathway Analysis (IPA) tools.

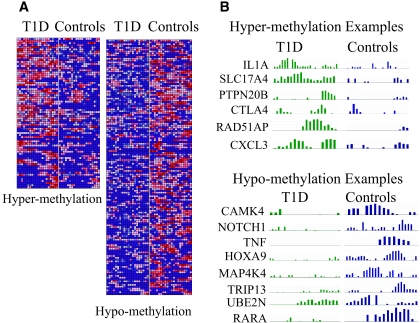
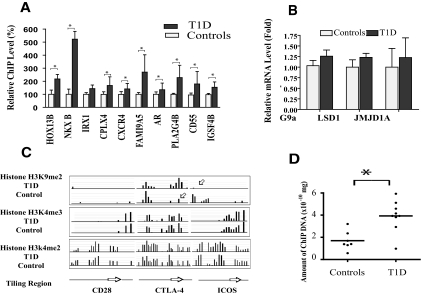
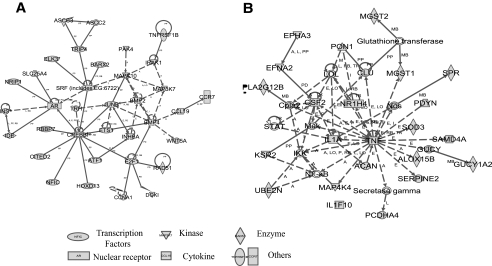
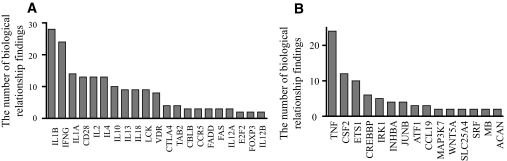
Results: A subset of genes in the type 1 diabetic cohort showed significant increase in H3K9me2 in lymphocytes but not in monocytes. CLTA4, a type 1 diabetes susceptibility gene, was one of the candidates displaying increased promoter H3K9me2 in type 1 diabetes. IPA identified two high-scoring networks that encompassed genes showing altered H3K9me2. Many of them were associated with autoimmune and inflammation-related pathways, such as transforming growth factor-beta, nuclear factor-kappaB, p38 mitogen-activated protein kinase, toll-like receptor, and interleukin-6. IPA also revealed biological relationships between these networks and known type 1 diabetes candidate genes.

Conclusions: The concerted and synergistic alteration of histone methylation within the identified network in lymphocytes might have an effect on the etiology of type 1 diabetes and its complications. These studies provide evidence of a novel association between type 1 diabetes and altered histone methylation of key genes that are components of type 1 diabetes-related biological pathways and also a new understanding of the pathology of type 1 diabetes.


Figures

FIG. 1.
FIG. 1.
Profiling histone lysine methylation in blood cells from type 1 diabetic (T1D) patients versus healthy control subjects. A: The overall experimental design. B: Hierarchically clustered histone H3K9me2 profiles of lymphocyte samples from patients with type 1 diabetes and healthy control subjects (columns) and 10,053 probes (rows). Of the total 12,055 probes in the 12K cDNA array, 2,002 probe signal intensities were below the threshold limit of detection, and this yielded 10,053 probes. The region at the bottom showing clear differences in a subset of genes in type 1 diabetes is depicted in the enlarged section on the right. C: Demographics for the type 1 diabetic patients and healthy control subjects. SAM, significance analysis of microarrays. (Please see http://dx.doi.org/10.2337/db08-0645 for a high-quality digital representation of this figure.)
FIG. 2.
FIG. 2.
Analysis of histone H3K9 dimethylation alterations between type 1 diabetic patients (T1D) and healthy control subjects using significance analysis of microarrays (SAM). A: Human 12K cDNA array results. a: SAM analysis of type 1 diabetic versus healthy control lymphocytes. b: Type 1 diabetic versus healthy control monocytes. c: Older subjects (age >45) versus younger subjects (age <45). d: Men versus women. Right: Heatmap of histone H3K9me2 in lymphocytes from type 1 diabetic patients versus healthy control subjects. B: Human 12K CpG array results. a: SAM analysis of type 1 diabetic versus healthy control lymphocytes. b: Type 1 diabetic versus healthy control monocytes. c: Older subjects (age >45) versus younger subjects (age <45). d: men versus women. Right panels in A and B are heatmaps ofH3K9me2 in lymphocytes from type 1 diabetic patients versus healthy control subjects. ES, espected score; OS, observed score. (Please see http://dx.doi.org/10.2337/db08-0645 for a high-quality digital representation of this figure.)
FIG. 3.
FIG. 3.
Promoter tiling array data showing variations of histone H3K9me2 between type 1 diabetic (T1D) patients and healthy control subjects in human promoter regions. A: Heatmap of histone H3K9me2 variations in promoter tiling arrays. Histone H3K9me2 ChIPs from type 1 diabetic patients and healthy control subjects (pooled from each group) were hybridized to human promoter tiling arrays (Nimblegen). Using the peak detection program MPeak, we located which promoters on the genome depicted H3K9me2 changes and located their positions by identifying clustered areas of probes that exhibit high ratio values. MPeak results were compiled and filtered for significant peaks with P values ≤0.05. A threshold cutoff ratio of twofold was used to generate the set of peaks, and probe-level values were uploaded to GenePattern's HeatMapImage software to create the heatmaps. B: Selected examples of hyper- and hypomethylated genes are illustrated by SignalMap. (Please see http://dx.doi.org/10.2337/db08-0645 for a high-quality digital representation of this figure.)
FIG. 4.
FIG. 4.
Validation of histone methylation alterations and quantification of histone methylase/demethylase mRNA levels in type 1 diabetic patients and healthy control subjects. A: Validation of histone methylation alterations in cDNA and CpG arrays. Conventional ChIPs were carried out on selected candidate genes to verify the alterations in histone H3K9me2 observed from the ChIP-chip experiments. ChIP real-time quantitative PCR analyses were performed with corresponding primers (listed in the supplemental methods in the online appendix). Results shown are means ± SE of triplet real-time PCRs. *P < 0.05 vs. healthy control subjects, by t tests. B: Real-time quantitative PCR quantification of histone methylase/demethylase mRNA levels. Total RNAs were prepared from the lymphocytes of six type 1 diabetic patients and six healthy control subjects for mRNA quantification by real-time quantitative PCR. β-Actin was used as internal control. Data shown (mean ± SE) are from two sets of PCRs with each independent patient sample with each sample run in triplicate. C: Histone modification status at CTLA-4, CD28, and ICOS promoter regions in lymphocytes from type 1 diabetic patients and healthy control subjects. Pooled histone ChIPs from type 1 diabetic patients and healthy control subjects were hybridized to human promoter tiling arrays, and the data were extracted according to standard operating procedures of NimbleGen. Result was visualized by SignalMap. Arrows indicate hyper- or hypohistone methylation. D: Conventional ChIP validation of H3K9me2 modification status at CTLA4 promoter region in lymphocytes from individual type 1 diabetic patients and the healthy control group. Data show results from typical standardized experiments to quantify the amount of specific modified ChIP DNA in type 1 diabetic patient and healthy control population using real-time quantitative PCR. In this particular experiment, nine type 1 diabetic and seven healthy control samples were included. The results indicate a significantly greater H3K9me2 enrichment at the CTLA4 promoter region in the type 1 diabetic group relative to healthy control group (*P = 0.0023 vs. healthy control subjects, by t tests).
FIG. 5.
FIG. 5.
The networks of altered histone methylation genes created by IPA. The hypothetical networks generated by IPA based on the molecular relationships, interactions, and pathway associations between the methylated candidate genes are shown in a graphical representation. A: The top-scoring network consists of 35 focus genes generated from cDNA and CpG arrays data. B: The top-scoring network consists of 20 focus genes generated from promoter tiling array data. Proteins are represented as nodes, and the biological relationship between two nodes is represented as an edge (line), which includes interactions, activation, inhibition, proteolysis, phosphorylation, and transcription events. Continuous lines, direct interaction; dotted lines, indirect interaction. A, activation/deactivation; RB, regulation of binding; PP, protein-protein binding; PD, protein-DNA binding; I, inhibition; L, proteolysis; P, phosphorylation/dephosphorylation; T, transcription.
FIG. 6.
FIG. 6.
Biological relationships between type 1 diabetes–related genes and our top-scoring networks based on literature findings. Known type 1 diabetes–related genes (Table S6 in the online appendix) were queried for their biological relationships to the identified top-scoring networks (Fig. 5A and B) from our study. The bar graphs show the number of biological relationships between type 1 diabetes–related genes and genes in our networks based on literature findings. Genes are placed in the order of the number of biological relationships from highest (left) to lowest (right). A: Relationships between type 1 diabetes–related genes with our genes. B: Relationships between our genes and type 1 diabetes–related genes. All biological relationships can also been seen in supplementary Fig. S1 in the online appendix.

Comment in

References

    1. Davies JL, Kawaguchi Y, Bennett ST, Copeman JB, Cordell HJ, Pritchard LE, Reed PW, Gough SC, Jenkins SC, Palmer SM, Balfour KM, Rowe BR, Farrall M, Barnett AH, Bain SC, Todd JA: A genome-wide search for human type 1 diabetes susceptibility genes. Nature 371 :130 –136,1994 - PubMed
    1. Todd JA, Walker NM, Cooper JD, Smyth DJ, Downes K, Plagnol V, Bailey R, Nejentsev S, Field SF, Payne F, Lowe CE, Szeszko JS, Hafler JP, Zeitels L, Yang JH, Vella A, Nutland S, Stevens HE, Schuilenburg H, Coleman G, Maisuria M, Meadows W, Smink LJ, Healy B, Burren OS, Lam AA, Ovington NR, Allen J, Adlem E, Leung HT, Wallace C, Howson JM, Guja C, Ionescu-Tirgoviste C, Simmonds MJ, Heward JM, Gough SC, Dunger DB, Wicker LS, Clayton DG: Robust associations of four new chromosome regions from genome-wide analyses of type 1 diabetes. Nat Genet 39 :857 –864,2007 - PMC - PubMed
    1. An Essay by Dr. John Todd [article online],2002. . Available from http://www.esi-topics.com/diabetes/interviews/DrJohnTodd.html
    1. Jirtle RL, Skinner MK: Environmental epigenomics and disease susceptibility. Nat Rev Genet 8 :253 –262,2007 - PMC - PubMed
    1. Klug A, Rhodes D, Smith J, Finch JT, Thomas JO: A low resolution structure for the histone core of the nucleosome. Nature 287 :509 –516,1980 - PubMed

Publication types

MeSH terms