. 2008 Oct;36(18):5750-62.
doi: 10.1093/nar/gkn553. Epub 2008 Sep 6.

RAG2's non-core domain contributes to the ordered regulation of V(D)J recombination

Affiliations

RAG2's non-core domain contributes to the ordered regulation of V(D)J recombination

John D Curry et al. Nucleic Acids Res. 2008 Oct.

Abstract

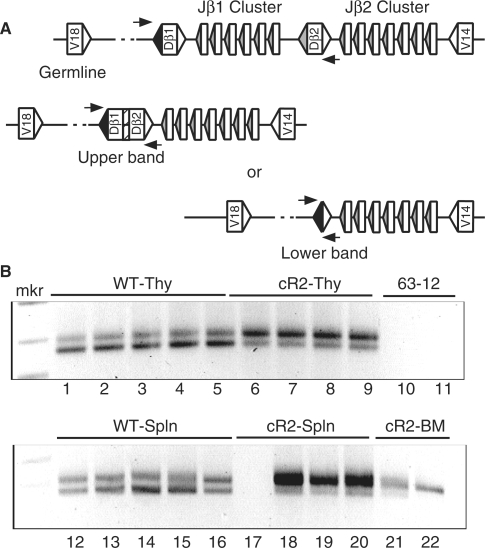
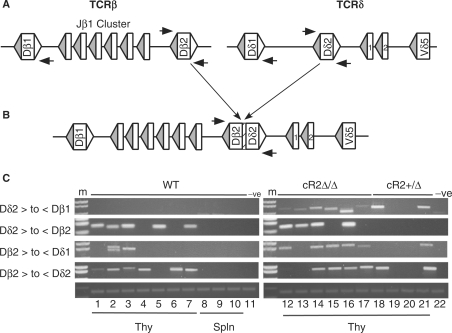
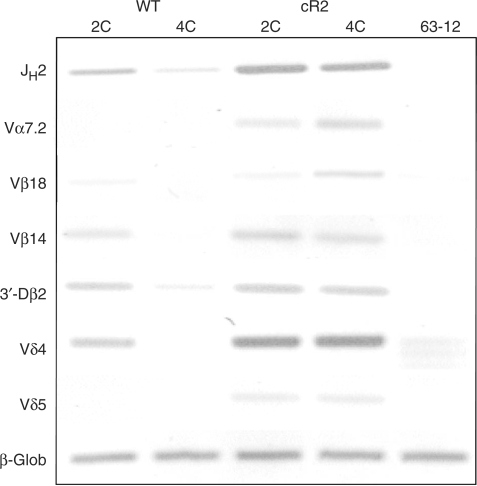
Variable (diversity) joining [V(D)J] recombination of immune gene loci proceeds in an ordered manner with D to J portions recombining first and then an upstream V joins that recombinant. We present evidence that the non-core domain of recombination activating gene (RAG) protein 2 is involved in the regulation of recombinatorial order. In mice lacking the non-core domain of RAG2 the ordered rearrangement is disturbed and direct V to D rearrangements are 10- to 1000-times increased in tri-partite immune gene loci. Some forms of inter-chromosomal translocations between TCRbeta and TCRdelta D gene segments are also increased in the core RAG2 animals as compared with their wild-type (WT) counterparts. In addition, the concise use of proper recombination signal sequences (RSSs) appears to be disturbed in the core RAG2 mice as compared with WT RAG2 animals.


Figures

Figure 1.
Figure 1.
PCR amplification of direct V-to-D rearrangements obtained from splenocyte genomic DNA purified from WT and cR2 mice. (A) Diagram shows a portion of the TCRβ locus in its germline configuration with the positions of PCR primers (horizontal arrows) used to direct amplification of the products shown below (not to scale). Rectangles illustrate coding segments of V, D and J types. Triangles indicate RSS with either 23 bp (unfilled) or 12 bp (filled) spacers. Splenic DNA from individual WT (lane 2) or cR2 (lanes 3 and 4) mice was amplified with Vβ8 forward primers and either Dβ1 or Dβ2 return primers. The negative image of an ethidium-stained gel is shown. An MspI-digested pBR322 DNA marker (mkr) is shown as well as negative PCR control (lane 5, 62-12, RAG2 null cell line DNA). (B) Diagram shows the germline configuration of a portion of the IgH locus with the first two V gene segments followed by the first four D gene segments. Splenic (lanes 2 and 3) and control (lane 4) DNA samples were subjected to PCR with the primers indicated by arrows in the diagram. The negative image of an ethidium-stained gel is shown.
Figure 2.
Figure 2.
Frequency of complete Vβ7-to-Dβ-to-Jβ2.7 and direct Vβ7-to-Dβ rearrangements in cR2 and WT mice. (A) Diagram of the mouse TCRβ locus indicating germline configuration (top) as well as complete VDJ and direct VD rearrangements utilizing Vβ7. Real-time qPCR primers are shown as horizontal arrows and the probe as a line bounded by circles. DNA purified from the thymus or spleen of sets of four animals of each genotype was analyzed by real-time PCR for complete VDJ (B) and direct VDβ1 and VDβ2 (C) rearrangements and the mean values (bars) SEs (whiskers) are shown.
Figure 3.
Figure 3.
Frequency of complete VH-to-DH-to-JH and direct VH-to-DH rearrangements in cR2 and WT mice. (A) Diagram of a portion of the mouse IgH locus in its germline configuration (upper; only a subset of the total number of D segments bounded by RSS-12 are shown) as well as complete VDJ and direct VD rearrangements (VD-del and VD-inv, deletion and inversion) utilizing VH81x and DFL16.1. Real-time qPCR primers are shown as horizontal arrows and the probe (line bounded by circles). (B) DNA purified from the indicated tissues was analyzed for complete VDJ (upper) or direct VD joints (middle and lower; deletion or inversion). Hybrid joints (not illustrated) were excluded by placing the D segment primer just within that coding segment. Four animals from each of the three possible genotypes were examined and the mean values (bars) with SEs (whiskers) are shown.
Figure 4.
Figure 4.
Dβ gene segments are frequently deleted in cR2 mice as compared with WT mice. (A) Diagram of a portion of the TCRβ locus showing the Dβ2 gene segment in its germline configuration (upper) and after a deletion event (lower). Horizontal arrows indicate the relative positions of a set of PCR primers that amplify the Dβ gene segment from HaeIII-restricted genomic DNA from either cR2 or WT thymus. (B) Negative image of agarose gel analysis of amplification products obtained from thymic DNA purified from six individual mice of the indicated genotypes (lanes 1–6) along with negative controls [reactions programmed with either DNA from 63-12, a RAG2-null cell line (lane 7) or H20 (lane 8)]. (C) The three cR2 PCR products (minus, lanes 1, 3 and 5) were restricted with ApaLI (plus, lanes 2, 4 and 6) which cleaves perfect signal joint sequences (GTG/CAC) remaining after deletion of the Dβ2 coding segment, releasing the expected fragments [341 and 106 bp (not visible)]. Sequence analysis of the PCR products further confirmed their nature (Supplementary Table S3).
Figure 5.
Figure 5.
Dβ2 coding segment deletion can occur via an intrachromosomal recombination reaction. (A) Diagram illustrating TCRβ locus structure of a heterozygous mutant in which a portion of the locus has been deleted by gene targeting resulting in the presence of only one copy of the Dβ2 gene segment. (B) Diagram showing a direct PCR strategy to detect perfect signal joints resulting from the deletion of Dβ2 gene segments. One of the PCR primers (horizontal arrows) overlaps the signal joint by several base pairs precluding the amplification of unrearranged gene segments. (C) Agarose gel analysis of PCR products obtained from the genomic DNA of several individual mice with either WT (Dβ2 +/+) or heterozygous Dβ2-deleted (Dβ2 +/KO) genotypes. The identities of PCR fragments were confirmed by DNA sequence analysis (Supplementary Table S3). Amplification of the β-globin locus serves as a DNA loading control. 63-12 is a RAG2-null cell line whose DNA served as a negative control.
Figure 6.
Figure 6.
Dβ1-to-Dβ2 coding joints in cR2 mice. (A) Diagrams showing two types of rearrangements between the Dβ segments in the TCRβ locus. Recombination targeting the Dβ1-RSS-23 (open triangle) and Dβ2-RSS-12 (filled triangle) results in a coding joint with N-nucleotides (hatched) and recombination targeting the Dβ1-RSS-12 and the Dβ2-RSS-23 results in a signal joint. Relative positions of the PCR primers (horizontal arrows) are shown. (B) A single round of PCR was used to amplify genomic DNA purified from the indicated tissues (Thy, thymus; Spln, spleen; BM, bone marrow) from multiple individual mice. An agarose gel analysis of PCR products is shown with the size of coding joints (upper band, 308 bp) and signal joints (lower band, 278 bp) shown. Joint structures were confirmed by DNA sequence analysis (Supplementary Table S3). 63-12 is a RAG2-null cell line whose DNA served as a negative control.
Figure 7.
Figure 7.
Interchromosomal rearrangements (translocations) between TCRβ and TCRδ D gene segments. (A) Diagram of the germline configurations of the TCRβ (left) and TCRδ (right) loci. Rectangles represent coding gene segments (D's as marked and J's numbered) bounded by RSS-12 (filled) and RSS-23 (open) triangles. Nested amplifications were directed by primers (horizontal arrows) adjacent to the four D gene segments. (B) Diagram of a translocation between Dβ2 and Dδ2 resulting in a coding joint complete with N-region (hatched). (C) Agarose gel analyses of PCR products from reactions programmed with cR2 (homozygous or heterozygous) or WT genomic DNA purified from thymocytes (lanes 1–7 and 12–21) or splenocytes (lanes 8–10) from individual mice, or 63-12 (RAG2-null negative control) cell line DNA as indicated. PCR primer directions are given as forward (>) or reverse (<) for D gene segments indicated. Joint structures were confirmed by DNA sequence analysis (Supplementary Table S3).
Figure 8.
Figure 8.
Analysis of dsDNA RSS breaks in WT and cR2 thymocytes sorted based on DNA content (2C, 4C). Nuclei from several (pooled) 1-month-old mouse thymi were stained with PI and sorted into 2C (G0/G1) and 4C (G2/M) populations. Genomic DNA was subjected to LM-PCR to detect RSS breaks at the indicated antigen receptor gene segment RSSs. The negative image of an ethidium-stained agarose gel is shown. 63-12 is a RAG2-null cell line whose DNA served as a negative control. The direct amplification of β-globin serves as a DNA-loading control.

References

    1. Tonegawa S. Somatic generation of antibody diversity. Nature. 1983;302:575–581. - PubMed
    1. Alt F, Yancopoulos G, Blackwell T, Wood C, Thomas E, Boss M, Coffman R, Rosenberg N, Tonegawa S, Baltimore D. Ordered rearrangement of immunoglobulin heavy chain variable region segments. EMBO J. 1984;3:1209–1219. - PMC - PubMed
    1. VanDyk LF, Wise TW, Moore BB, Meek K. Immunoglobulin D(H) recombination signal sequence targeting: effect of D(H) coding and flanking regions and recombination partner. J. Immunol. 1996;157:4005–4015. - PubMed
    1. Fugmann SD, Lee AI, Shockett PE, Villey IJ, Schatz DG. The RAG proteins and V(D)J recombination: complexes, ends, and transposition. Annu. Rev. Immunol. 2000;18:495–527. - PubMed
    1. Liu Y, Subrahmanyam R, Chakraborty T, Sen R, Desiderio S. A plant homeodomain in RAG-2 that binds hypermethylated lysine 4 of histone H3 is necessary for efficient antigen-receptor-gene rearrangement. Immunity. 2007;27:561–571. - PMC - PubMed

Publication types

MeSH terms

Substances