. 2008 Oct;4(10):617-23.
doi: 10.1038/nchembio.113. Epub 2008 Sep 7.

Quantitative exploration of the catalytic landscape separating divergent plant sesquiterpene synthases

Affiliations

Quantitative exploration of the catalytic landscape separating divergent plant sesquiterpene synthases

Paul E O'Maille et al. Nat Chem Biol. 2008 Oct.

Abstract

Throughout molecular evolution, organisms create assorted chemicals in response to varying ecological niches. Catalytic landscapes underlie metabolic evolution, wherein mutational steps alter the biosynthetic properties of enzymes. Here we report the first systematic quantitative characterization of the catalytic landscape underlying the evolution of sesquiterpene chemical diversity. On the basis of our previous discovery of a set of nine naturally occurring amino acid substitutions that functionally interconverted orthologous sesquiterpene synthases from Nicotiana tabacum and Hyoscyamus muticus, we created a library of all possible residue combinations (2(9) = 512) in the N. tabacum enzyme. The product spectra of 418 active enzymes revealed a rugged landscape where several minimal combinations of the nine mutations encode convergent solutions to the interconversions of parental activities. Quantitative comparisons indicated context dependence for mutational effects--epistasis--in product specificity and promiscuity. These results provide a measure of the mutational accessibility of phenotypic variability in a diverging lineage of terpene synthases.


Figures

Figure 1
Figure 1. Terminal cyclization steps of TEAS and HPS terpene synthases
(a) TEAS and HPS exert differential conformational control on a common carbocation intermediate to produce 5-epi-aristolochene (5-EA, 2) and premnaspirodiene (PSD, 3), in the blue and red circles, respectively. The discovery of 4-epi-eremophilene (4-EE, 4) biosynthetic activity supports hybridization of the final two biosynthetic steps (the purple intersection) in TEAS and HPS involving a methyl migration shared with TEAS and a final deprotonation at carbon 6 shared with HPS. (b) Proposed reaction coordinate for the methyl (blue trace) and alkyl (red trace) migrations extending from a common carbocation intermediate (defined as zero energy) through a transition state (‡) leading to the penultimate carbocations of their respective reaction pathways. Calculated energies are expressed in units of Kcal mol−1. (c) Conformations of the methyl (top) or alkyl (bottom) migration transition states as calculated from density functional theory (DFT) calculations (Supplementary Fig. 1 online). Carbon atoms are shown in gold with the carbocation center colored red (marked by a plus sign); dashed blue lines indicate newly forming bonds, and hydrogen atoms are omitted for clarity.
Figure 2
Figure 2. Overall structure of TEAS, location and identity of M9 residues
(a) Nucleotide and amino acid identity of substitutions between TEAS and HPS. Shading is used to indicate nucleotide substitutions in HPS relative to the TEAS reference sequence. (b) The primary structure is composed of N-terminal (blue) and C-terminal (gold) terpenoid synthase domains. Amino acid positions of the M9 library are indicated using TEAS numbering. (c) Tertiary structure of TEAS (pdb id 5eat) shown as ribbons with domains colored (as in a) and Mg2+ and FPP (1) modeled into the active site. (d) The spatial distribution of M9 library residues is depicted, where the active site is rendered as a continuous van der Waal’s surface (positions 402 and 516 highlighted in red) and second tier residues (colored side chains) are arrayed behind the active site proper.
Figure 3
Figure 3. Phylogenetic distribution of Solanaceous TEAS and HPS-like terpene synthases
(a) An un-rooted phylogenetic tree of 5-EA and PSD terpene synthases was created form available sequences (Supplementary Table 1 online) where branches are colored according to the established or putative functions as TEAS-like (blue) or HPS-like (red). (b) Sequence alignment of the M9 residue positions of the sequences (panel a) with HPS like residues shaded in grey.
Figure 4
Figure 4. Activities of the M9 lineage
(a) A 3-D scatter plot of the product output (chemical space) was constructed where the x, y, and z-axes correspond to percentages of the major products 5-EA (2), 4-EE (4), and PSD (3), respectively (Supplementary Table 3 online). Each sphere represents one of the 418 active mutant proteins from the M9 library with wild type TEAS, M9 and EES highlighted as enlarged spheres. The tetrahedron encompassing the scatter plot was partitioned to represent each of the major reaction products by choosing the midpoint of each axis for subdividing into geometrically equivalent tetrahedrons. Each shaded volume, blue (5-EA, 2), purple (4-EE, 4), or red (PSD, 3) indicates product specificity of 50% or greater. Mutants in the remaining central volume (cyan) are defined as promiscuous. (b) Schematic of the scatter plot (panel a) summarizing the distribution of activities where the number of mutants in each quadrant is expressed as a percentage of the total number characterized.
Figure 5
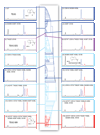
Figure 5. Biosynthetic tree of the M9 library
A similarity-based cluster diagram was constructed to quantitatively organize the M9 library according to terpene product spectra from the pair-wise alignment of product proportions for each of the 418 active mutants (described in Methods). Clades are colored according to the major reaction product (defined in Fig. 4a), with representative chromatograms identified and numbered branching off each major clade. Product peaks in the chromatograms are colored blue (5-EA, 2), purple (4-EE, 4) or red (PSD, 3).
Figure 6
Figure 6. Average inter-neighbor distances (AID) in chemical and sequence space
A representative mutant (unlabeled red sphere) is shown in chemical space along with all nine possible single mutant neighbors (numbered green spheres) to illustrate a, short, b, medium, and c, high average inter-neighbor mutational distances (AID). Sequences of each representative mutant are referenced across the top of the three alignment tables with mutational neighbors and distances listed below. Each mutated position is boxed and residues of HPS origin are indicated with shading. (d) The average inter-neighbor distance (AID) for a subset of 236 mutants was plotted as a simple histogram, where the shoulders and apex of the distribution are labeled a, b and c to correspond to representative mutants above. (e) The distribution of AID as a function of the number of accumulated HPS substitutions was plotted, where M1 refers to all single mutants, M2 to all double mutants and so on.
Figure 7
Figure 7

References

    1. Grayer RJ, Kokubun T. Phytochemistry. 2001;56(3):253. - PubMed
    1. Pedras MSC, Okanga FI, Zaharia IL, et al. Phytochemistry. 2000;53(2):161. - PubMed
    1. Harborne JB. Biochemical Systematics and Ecology. 1999;27(4):335. - PubMed
    1. Akiyama K, Matsuzaki K, Hayashi H. Nature. 2005;435(7043):824. - PubMed
    1. Mumm R, Hilker M. Chemical Senses. 2005;30(4):337. - PubMed

Publication types