. 2008 Oct;11(10):1201-10.
doi: 10.1038/nn.2191. Epub 2008 Sep 7.

Neural correlates of multisensory cue integration in macaque MSTd

Affiliations

Neural correlates of multisensory cue integration in macaque MSTd

Yong Gu et al. Nat Neurosci. 2008 Oct.

Abstract

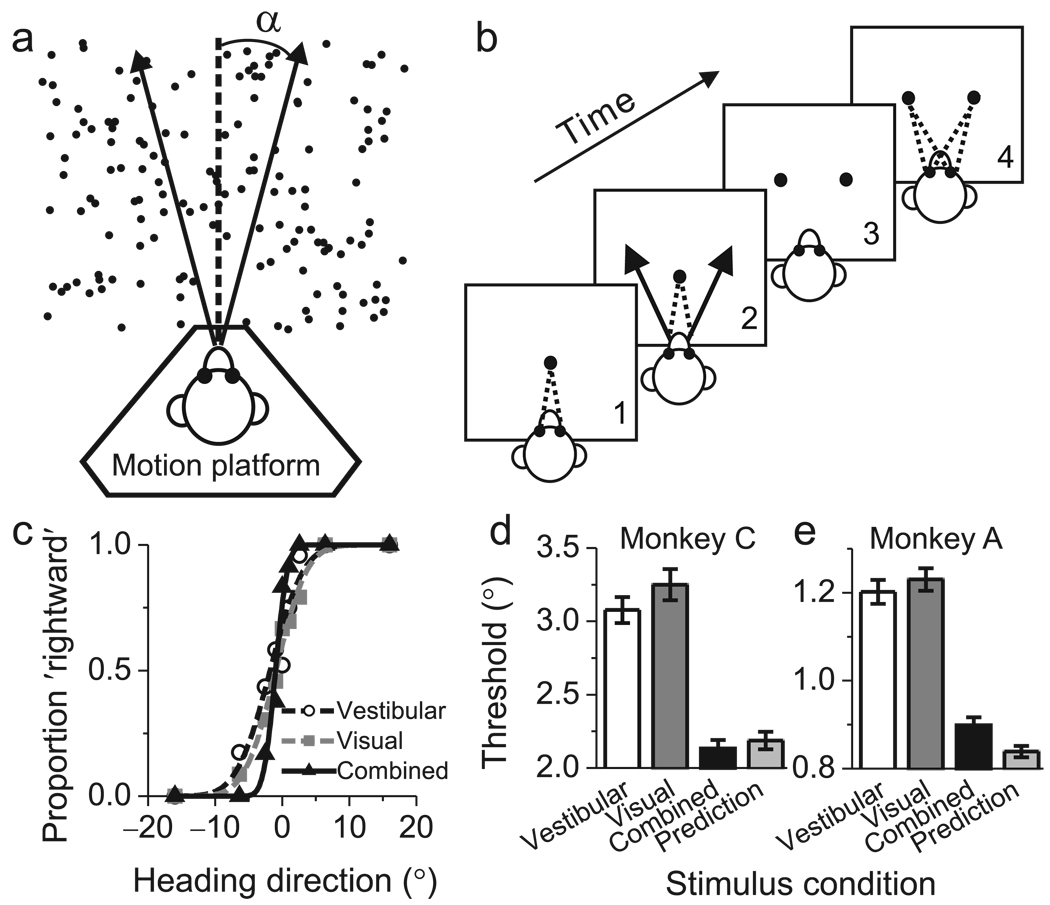
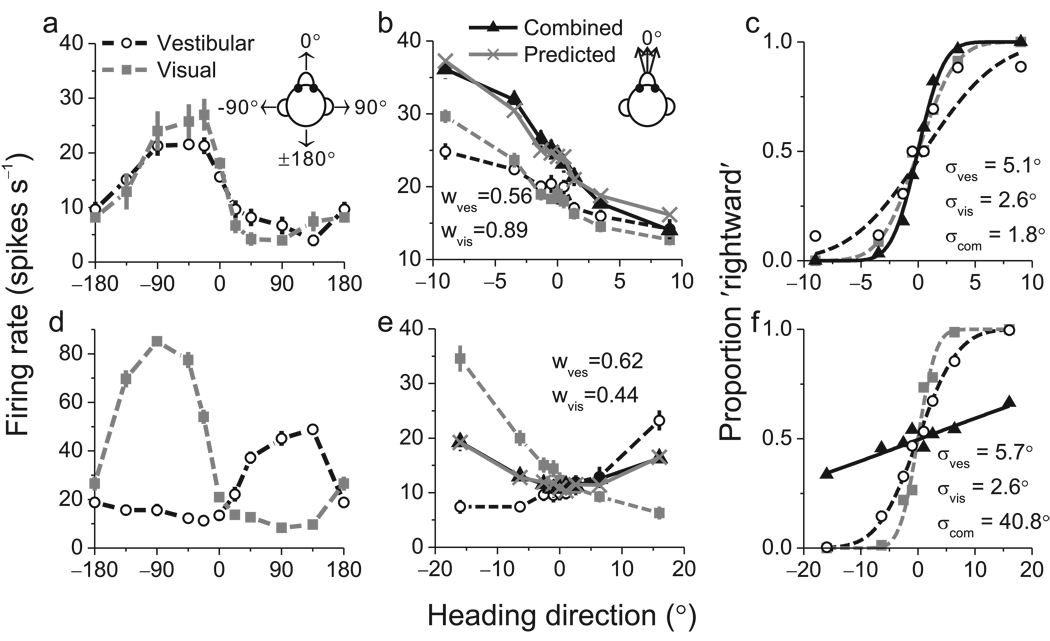
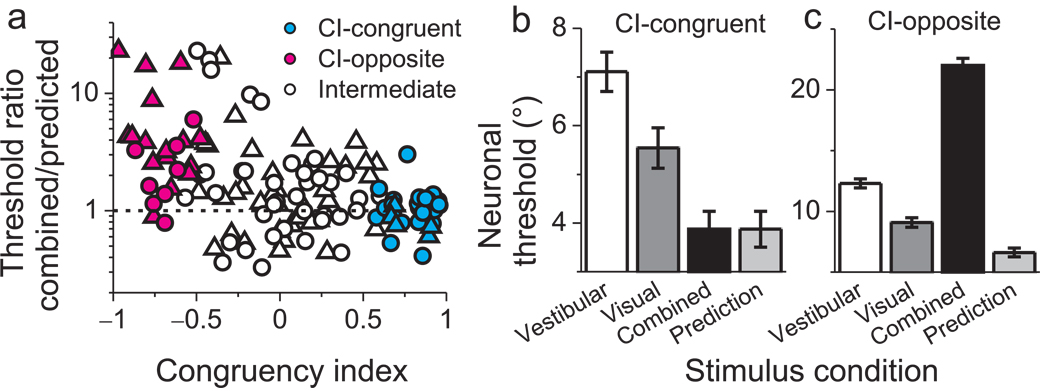
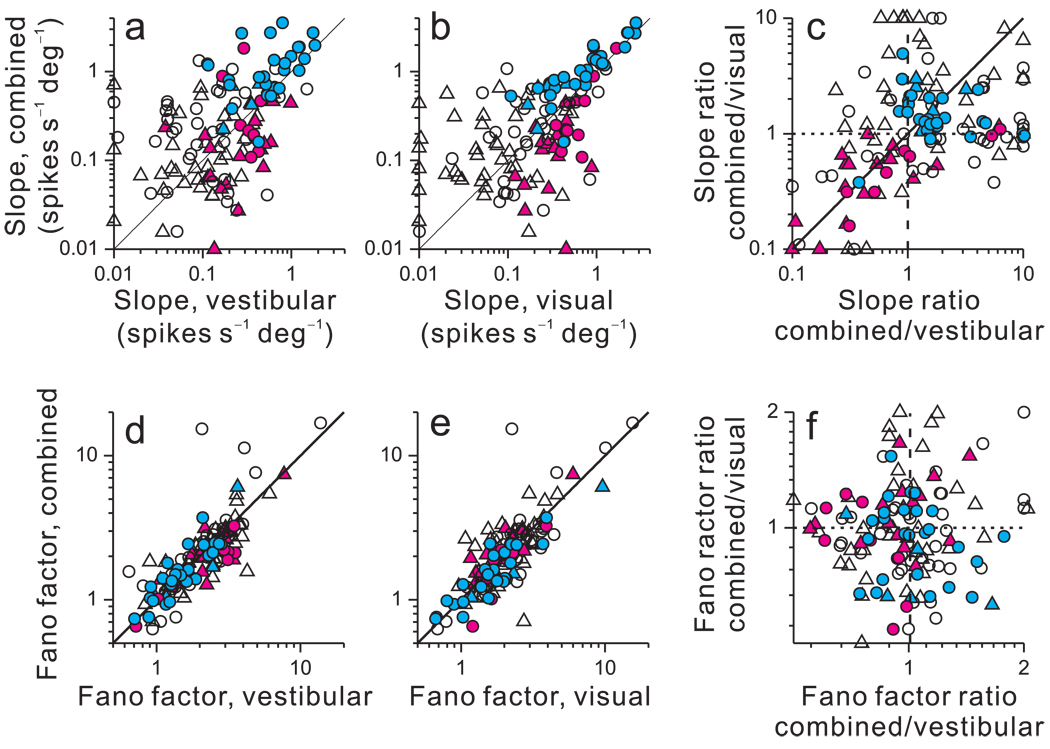
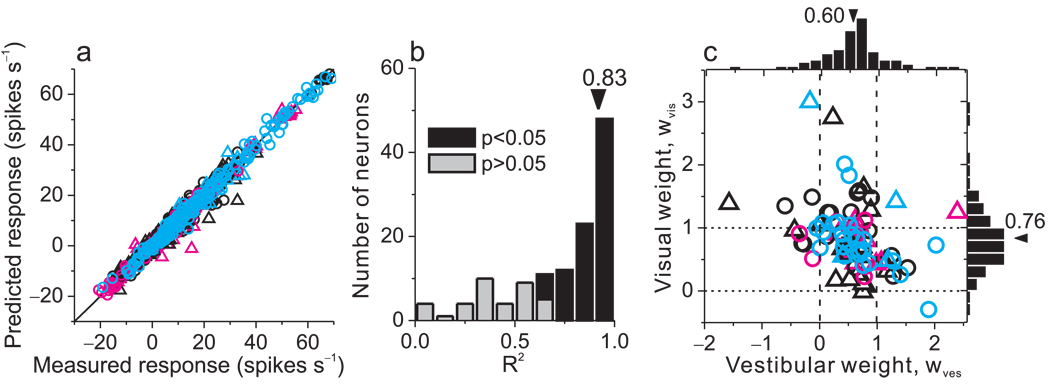
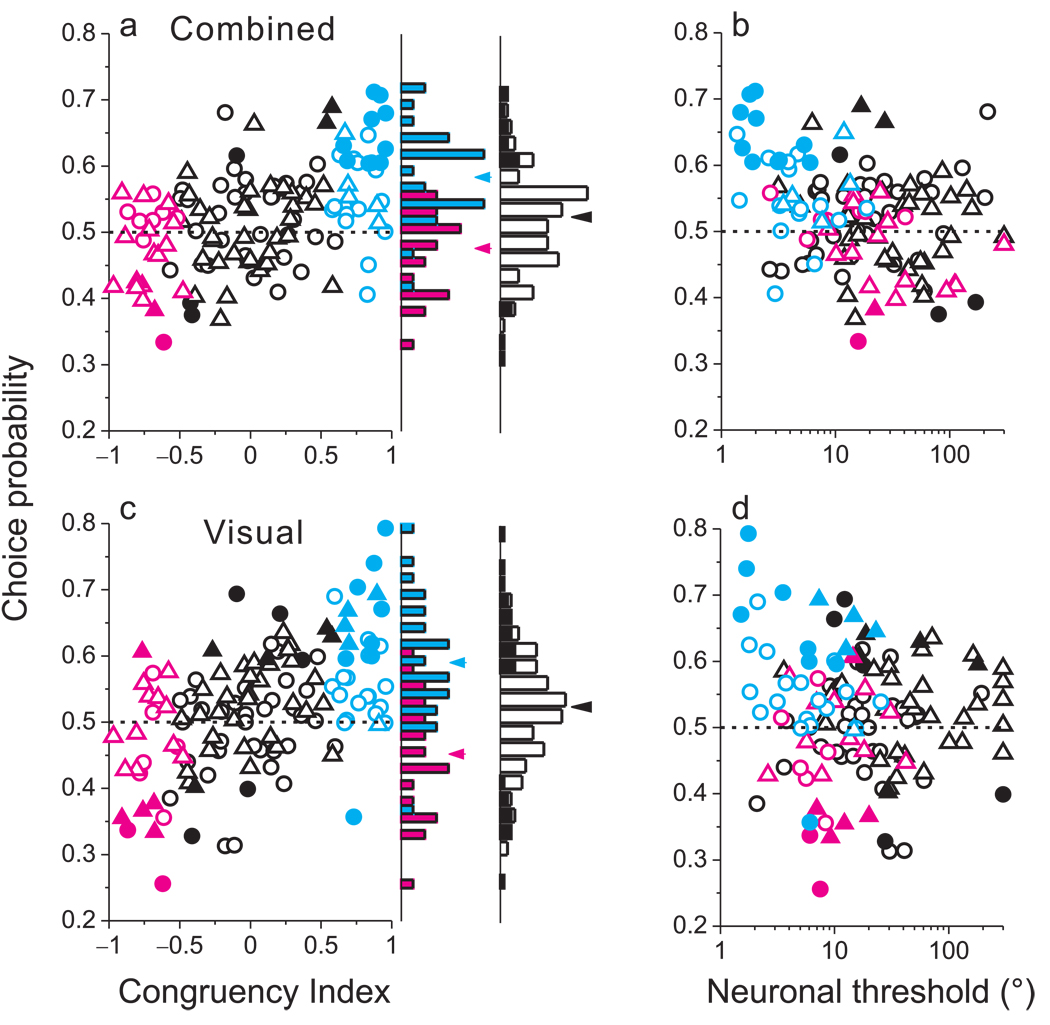
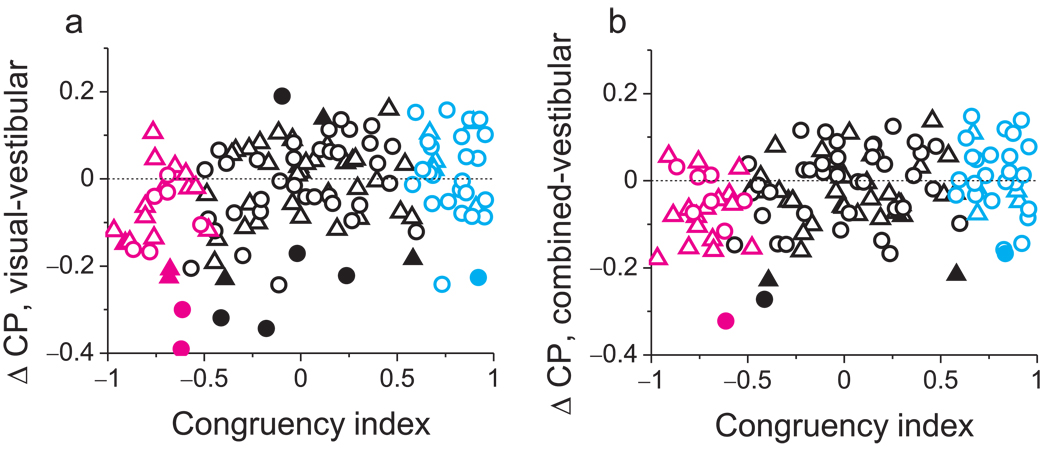
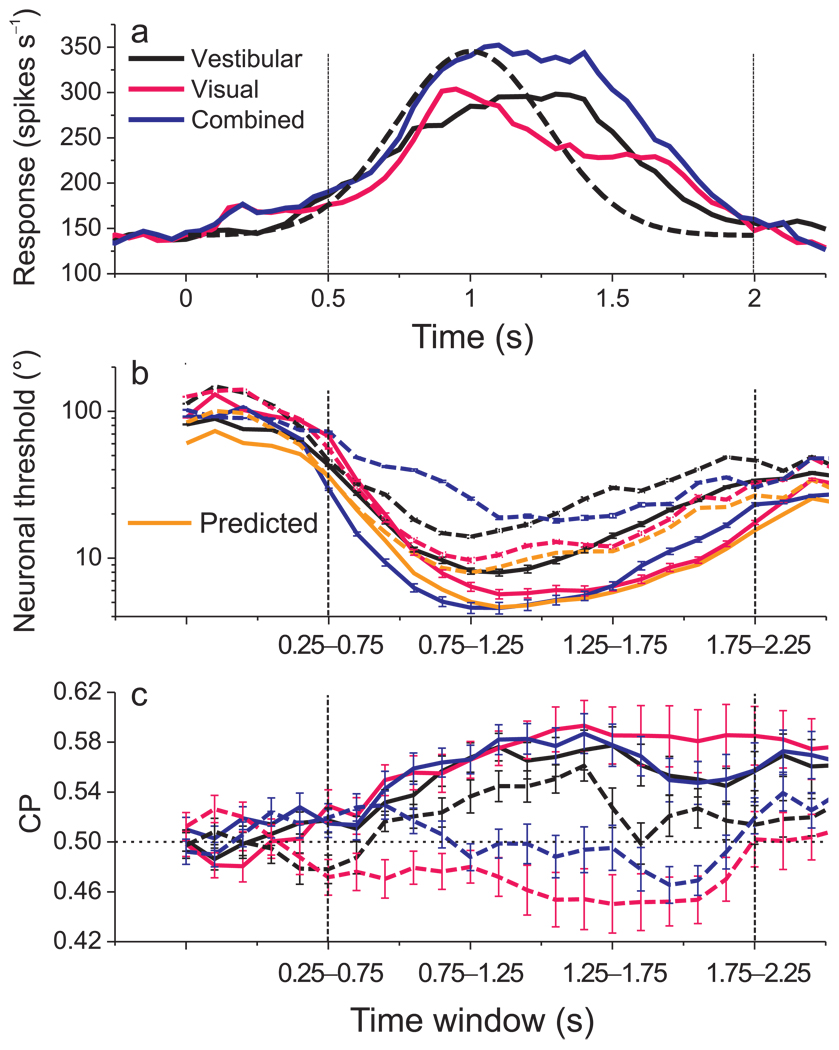
Human observers combine multiple sensory cues synergistically to achieve greater perceptual sensitivity, but little is known about the underlying neuronal mechanisms. We recorded the activity of neurons in the dorsal medial superior temporal (MSTd) area during a task in which trained monkeys combined visual and vestibular cues near-optimally to discriminate heading. During bimodal stimulation, MSTd neurons combined visual and vestibular inputs linearly with subadditive weights. Neurons with congruent heading preferences for visual and vestibular stimuli showed improvements in sensitivity that parallel behavioral effects. In contrast, neurons with opposite preferences showed diminished sensitivity under cue combination. Responses of congruent cells were more strongly correlated with monkeys' perceptual decisions than were responses of opposite cells, suggesting that the monkey monitored the activity of congruent cells to a greater extent during cue integration. These findings show that perceptual cue integration occurs in nonhuman primates and identify a population of neurons that may form its neural basis.


Figures

Figure 1
Figure 1
Heading task and behavioral performance. (a) Monkeys were seated on a motion platform and translated within the horizontal plane. A projector mounted on the platform displayed images of a 3D star field, thus providing optic flow. (b) After fixating a visual target, the monkey experienced forward motion with a small leftward or rightward (arrow) component, and subsequently reported his perceived heading ('left' vs. 'right') by making a saccadic eye movement to one of two targets. (c) Example psychometric functions from one session (~30 stimulus repetitions). The proportion of 'rightward' decisions is plotted as a function of heading, and smooth curves are best fitting cumulative Gaussian functions. White circles, gray squares, and black triangles represent data from the vestibular, visual and combined conditions, respectively. (d, e) Average psychophysical thresholds from two monkeys (Monkey C, N=57; Monkey A, N=72) for the 3 stimulus conditions, and predicted thresholds computed from optimal cue integration theory (light gray bars). Error bars: SEM.
Figure 2
Figure 2
Examples of neuronal tuning and neurometric functions for one congruent cell (a–c) and one opposite cell (d–f). (a) Heading tuning curves measured in the horizontal plane for the congruent cell. This neuron preferred leftward headings (near −90°) in both the vestibular (white circles) and visual (gray squares) conditions. (b) Responses of the same neuron to a narrow range of headings presented during the discrimination task. Responses in the combined condition (black triangles) were very similar to responses predicted from a weighted linear summation model (gray Xs). (c) Neurometric functions for the congruent cell computed by ROC analysis. Smooth curves show best-fitting cumulative Gaussian functions, with neuronal thresholds of 5.1°, 2.6° and 1.8° in the vestibular (white circles), visual (gray squares), and combined (black triangles) conditions, respectively. (d) Tuning curves for an opposite cell that preferred rightward motion in the vestibular condition and leftward motion in the visual condition. (e) Responses of the opposite cell during the discrimination task. Note that combined responses (black triangles) and predictions (gray Xs) fall between the single-cue responses. (f) Neurometric functions for the opposite cell, which has thresholds of 5.7°, 2.6° and 40.8° in the vestibular, visual, and combined conditions, respectively.
Figure 3
Figure 3
Neuronal sensitivity under cue combination depends on visual/vestibular congruency. (a) The vertical axis in this scatter plot represents the ratio of the threshold measured in the combined condition to that predicted by optimal cue integration. The horizontal axis represents the Congruency Index of heading tuning for visual and vestibular responses (CI, see Methods). Filled symbols denote neurons for which CI is significantly different from zero. Cyan and magenta symbols represent ‘CI-congruent’ and ‘CI-opposite’ cells, respectively. Triangles and circles denote data from monkeys C and A, respectively. (b) Average neuronal thresholds (geometric mean ± geometric SE) for 'CI-congruent' cells (significant CI > 0, N = 30). Note that the average combined threshold (black bar) is very similar to the optimal prediction (light gray bar). (c) Average neuronal thresholds for 'CI-opposite' cells (significant CI < 0, N = 24), which become less sensitive under cue combination. Note that the vertical scale differs between panels b and c to clearly show the cue combination effect for each group of neurons.
Figure 4
Figure 4
Effect of cue integration on tuning curve slopes and Fano factors. (a, b) Tuning curve slope in the combined condition is plotted against slope in the vestibular (a) and visual (b) conditions. For CI-congruent cells (cyan), slopes were steeper during cue combination than in either single-cue condition (p<0.001, sign tests). For CI-opposite cells (magenta), slopes were flatter in the combined condition (p<0.02, sign tests). For intermediate cells (black), slopes were not significantly different (p>0.1, sign tests). Data points with slopes <0.01 spikes/s/deg were plotted at 0.01 for clarity. (c) The ratio of combined/visual slopes is plotted again the ratio of combined/vestibular slopes. Data points with values <0.1 (or >10) were plotted at 0.1 (or 10) for clarity. (d, e, f) Variance to mean ratios (Fano factors) are plotted in the same format as a–c. Fano factors were marginally smaller for CI-opposite cells in the combined condition as compared to the vestibular condition (p=0.02, sign test) but not significantly different as compared to the visual condition (p>0.8, sign test). There were no significant differences for all other comparisons (p>0.2, sign tests). Circles: monkey A; Triangles: monkey C.
Figure 5
Figure 5
Combined condition responses are well approximated by linear weighted summation. (a) Predicted responses from weighted linear summation were strongly correlated with measured responses in the combined condition (R=0.99, p<<0.001). Each datum represents the response of one neuron at one heading angle; spontaneous activity was subtracted. (b) A correlation coefficient was computed, for each neuron, from a linear regression fit to the predicted and measured responses. The median R2 value was 0.83 and 89 cases (69%) were significant (p<0.05). Three cases with negative (but not significant) R2 values are not shown. (c) Visual and vestibular weights derived from the best fit of the linear weighted sum model for each neuron with significant R2 values (black bars in panel b). Median weights for vestibular and visual inputs were 0.6 and 0.76, respectively, which are significantly smaller than 1 (p<<0.001, t-tests). There is a significant negative correlation between vestibular and visual weights (R=−0.40, p<0.001, spearman rank correlation). Circles: monkey A; Triangles: monkey C.
Figure 6
Figure 6
Correlations between MSTd responses and perceptual decisions depend on congruency of tuning. (a) Choice probability (CP) is plotted against congruency index (CI) for all129 MSTd neurons tested during cue combination (triangles: monkey C; circles: monkey A). Cyan and magenta data points represent ‘CI-congruent’ and ‘CI-opposite’ cells, respectively. Filled symbols denote CPs significantly different from 0.5. The rightmost marginal histogram shows the distribution of CP values for all neurons, with filled bars denoting CPs significantly different from 0.5. The adjacent marginal histogram shows distributions of CP values for CI-congruent (cyan) and CI-opposite (magenta) cells. (b) CP is significantly anti-correlated with neuronal threshold during cue combination (R = −0.31, p<0.0003, Spearman rank correlation). (c) CPs in the visual condition, presented in the same format as panel a. CP was significantly correlated with CI (R=0.51, p<<0.001). (d) Visual condition CPs plotted as a function of neuronal thresholds.
Figure 7
Figure 7
Summary of effects of congruency on CP values across stimulus conditions. (a) The difference in CP between visual and vestibular conditions is plotted, for each neuron, against CI Filled symbols denote differences in CP that are significantly different from zero for individual neurons. Circles: monkey A; triangles: monkey C. Cyan and magenta data points represent ‘CI-congruent’ and ‘CI-opposite’ cells, respectively. (b) Differences in CP between the combined and vestibular conditions are plotted as a function of CI.
Figure 8
Figure 8
Temporal evolution of population responses, neuronal thresholds, and CPs. (a) Average responses across all 129 neurons are shown for each stimulus condition (black: vestibular; pink: visual; blue: combined). For each neuron, responses were taken from the heading that elicited maximum firing rate. Dashed curve: velocity profile of stimulus. Time zero represents stimulus onset and 2s represents offset. Vertical dashed lines: time range for temporal analysis. (b) Average neuronal thresholds for CI-congruent (solid) and CI-opposite (dashed) cells as a function of time from 0.50 to 2s. Thresholds were computed from responses within a 500ms sliding time window that was advanced in steps of 100ms. The orange curves show the time course of predicted thresholds for the combined condition. Error bars: SEM. (c) Average CPs for CI-congruent (solid) and CI-opposite (dashed) cells as a function of time, format as in panel b. Dashed horizontal line: chance level (CP=0.5).

Comment in

  • Right way neurons.
    Bennur S, Gold JI. Bennur S, et al. Nat Neurosci. 2008 Oct;11(10):1121-2. doi: 10.1038/nn1008-1121. Nat Neurosci. 2008. PMID: 18818590 No abstract available.

Similar articles

Cited by

References

    1. Jacobs RA. Optimal integration of texture and motion cues to depth. Vision Res. 1999;39:3621–3629. - PubMed
    1. Hillis JM, Watt SJ, Landy MS, Banks MS. Slant from texture and disparity cues: optimal cue combination. J Vis. 2004;4:967–992. - PubMed
    1. Knill DC, Saunders JA. Do humans optimally integrate stereo and texture information for judgments of surface slant? Vision Res. 2003;43:2539–2558. - PubMed
    1. van Beers RJ, Sittig AC, Gon JJ. Integration of proprioceptive and visual position-information: An experimentally supported model. J Neurophysiol. 1999;81:1355–1364. - PubMed
    1. Ernst MO, Banks MS. Humans integrate visual and haptic information in a statistically optimal fashion. Nature. 2002;415:429–433. - PubMed

Publication types

MeSH terms