. 2008 Oct;9(10):1122-30.
doi: 10.1038/ni.1647. Epub 2008 Sep 7.

Distinct functions for the transcription factors GATA-3 and ThPOK during intrathymic differentiation of CD4(+) T cells

Affiliations

Distinct functions for the transcription factors GATA-3 and ThPOK during intrathymic differentiation of CD4(+) T cells

Lie Wang et al. Nat Immunol. 2008 Oct.

Abstract

The transcription factors GATA-3 and ThPOK are required for intrathymic differentiation of CD4(+) T cells, but their precise functions in this process remain unclear. Here we show that, contrary to previous findings, Gata3 disruption blocked differentiation into the CD4(+) T cell lineage before commitment to the CD4(+) lineage and in some contexts permitted the 'redirection' of major histocompatibility complex class II-restricted thymocytes into the CD8(+) lineage. GATA-3 promoted ThPOK expression and bound to a region of the locus encoding ThPOK established as being critical for ThPOK expression. Finally, ThPOK promoted differentiation into the CD4(+) lineage in a way dependent on GATA-3 but inhibited differentiation into the CD8(+) lineage independently of GATA-3. We propose that GATA-3 acts as a specification factor for the CD4(+) lineage 'upstream' of the ThPOK-controlled CD4(+) commitment checkpoint.


Figures

Figure 1
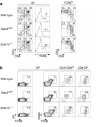
Figure 1. Zbtb7b disruption does not affect CD4 differentiation prior to the CD4-CD8 lineage commitment checkpoint
(a,b). Zbtb7b disruption selectively prevents CD4 T cell differentiation. (a) Thymocytes and splenocytes from the indicated mice were analyzed by 4-color flow cytometry. Numbers indicate the percentage of cells within boxes. (b) Bar graphs display the absolute numbers of mature CD4 SP (filled bars) and CD8 SP (open bars) thymocytes (top) and splenocytes (bottom). Note the distinct x-axis scales. Error bars indicate s.d. Data is from six mice of each genotype analyzed in six experiments. (c,d). Zbtb7b disruption redirects MHCII-restricted thymocytes to the CD8 lineage. (a) 4-color flow cytometry analyses were carried out on thymocytes from Zbtb7b+/+, Zbtb7b+/− and Zbtb7b−/− mice carrying the AND TCR transgene that, in I-Ab-expressing mice, promotes the positive selection of large numbers of CD4 SP cells expressing the transgenic Vα11 TCRα chain. Numbers indicate the percentage of cells within boxes. (d) Absolute numbers of mature thymocytes and splenocytes are displayed as in (b). Data is from 3 or 4 mice of each genotype analyzed in three experiments.
Figure 2
Figure 2. Gata3 disruption prevents CD4 differentiation but not positive selection
(a) Thymocytes from wild-type (Zbtb7b+/+ Gata3+/+), Zbtb7b−/− and Gata3ΔDP mice were analyzed by 4-color flow cytometry. (b) Expression of TCRβ and CD69, an indicator of TCR signaling, on DP, CD4+CD8int and CD8 SP thymocytes gated as in (a). Parallel experiments using an isotype control antibody (ctrl, left column) verify the specificity of anti-CD69 staining. Numbers near or within boxes, or above brackets, indicate the percentage of enclosed cells. Data is from three independent experiments comparing both genotypes.
Figure 3
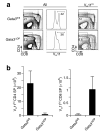
Figure 3. Gata3-deficient MHCII-restricted thymocytes undergo intrathymic signaling and are inefficiently redirected into the CD8 lineage
(a,b). Thymocytes from Rag2−/−Gata3ΔDP or Rag2−/−Gata3fl/fl mice carrying the 5CC7 TCR transgene were analyzed by 3-color flow cytometry. Numbers in plots indicate the percentage of cells within boxes or brackets. (b) Numbers of Vα11hi CD4 SP and CD8 SP thymocytes in Rag2−/−Gata3ΔDP or Rag2−/−Gata3fl/fl mice carrying the 5CC7 TCR transgene. Error bars indicate s.d. Data is from four separate experiments, each including three or more mice of each genotype. (c,d). Irradiated β2m-deficient hosts were reconstituted with bone marrow from Gata3fl/fl or Gata3ΔDP mice and analyzed 6 weeks after reconstitution. (c) Flow cytometry analyses of thymocytes in Gata3fl/fl- and Gata3ΔDP-derived chimeras (middle and bottom rows) and in an unmanipulated wild-type thymus (top row). Middle: dot plots depict gating on CD69 TCRlo (subset 1), CD69+ TCRint (subset 2); and TCRhi (subset 3) populations. (d) Absolute numbers of TCRhi CD4 SP and CD8 SP thymocytes (average ± s.d.) for each series of chimeras. Data is representative of two separate experiments, each including three or more chimeras of each genotype.
Figure 4
Figure 4. Gata3 is required upstream of Zbtb7b
(a,b). Comparison of Gata3 mRNA and protein expression in purified thymocyte subsets from Zbtb7b+/+ and Zbtb7b−/− mice. (a) Expression of Gata3 mRNA in CD69+ CD4+CD8int thymocytes, normalized to Actb mRNA and shown relative to Zbtb7b+/+ cells. (b) Gata3 protein expression, analyzed by immunoblotting of lysates prepared from the indicated populations; equal lane loading was verified by subsequent probing of the same membrane with anti-β-actin. Mature (lymph node, LN) T helper type 2 activated CD4 cells (lane 1) and activated CD8 cells (lane 2) were used as specificity controls. Data in (a) and (b) are representative of two separate experiments, from distinct sorted cell preparations, for each panel. The slight but reproducible increase in Gata3 expression in Zbtb7b−/− cells is probably caused by the greater representation of immature cells in the CD4+CD8int gate, due to the block caused by Zbtb7b disruption (Gata3 is normally down-regulated in the later stages of CD4 SP cell maturation11). (c,d). Immunoprecipitation and immunoblotting analyses of Zbtb7b protein expression in CD69+ thymocytes from the indicated mice. (c) MHCII-deficient thymocytes were used as a negative control. (d) Wedge denotes decreasing numbers of Gata3+/+ CD69+ thymocytes (respectively 2, 1, 0.3 and 0.1 × 10⁷). Data is representative of three distinct experiments.
Figure 5
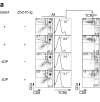
Figure 5. Zbtb7b requires Gata3 to promote CD4 but not to inhibit CD8 differentiation
(a,b). Thymocytes from mice expressing or lacking Gata3 and the Zbtb7b transgene as indicated (left) were analyzed by 3-color flow cytometry. (a) Numbers indicate the percentage of cells in boxes or within brackets. (b) Box and whiskers plots show absolute numbers of TCRhi thymocytes within CD4+CD8, CD4+CD8int and CD4CD8+ gates in each mouse strain. Data are representative of at least five mice of each genotype analyzed in more than five separate experiments. *, P < 0.05 by the exact two-tailed Wilcoxon rank sum test. We noted no detectable difference between Gata3+/+ and Gata3fl/fl genotypes and they were used interchangeably and considered as a single class for statistical analyses. (c). Spleen T cell populations were analyzed in one week-old mice of the indicated genotype by 3-color flow cytometry.
Figure 6
Figure 6. Gata3 is recruited to a region of the Zbtb7b locus critical for Zbtb7b expression
(a). Schematic of the Zbtb7b locus indicating regions of high sequence conservations in mammals (from the Mus musculus July 2007 assembly consulted on the UCSC Genome website, http://genome.ucsc.edu). The approximate position of two DNase I hypersensitivity (HS) sites are indicated by black horizontal bars. Wild-type and mutant BACs used in (b), in which the first coding exon of Zbtb7b was replaced by a GFP cDNA, are depicted; the modified Zbtb7b locus includes a translation stop codon at the end of the GFP ORF. The dashed lines indicate the deletion in construct ΔD. The location of sites A and B identified in (c,d) are indicated by vertical arrows. (b). Analyses of Zbtb7b expression in the indicated cell populations using GFP BAC reporters depicted in (a). Numbers in histograms indicate the mean GFP fluorescence intensity, expressed relative to that in CD4 T cells from mice carrying the wild-type construct arbitrarily set to 100. Expression of the ΔD deleted construct remained below detection in all T cell subsets analyzed. GFP expression was detected in three out of seven founders injected with the wild-type construct, but none of 11 founders injected with the ΔD construct. (c,d). ChIP analyses of Gata3 binding to the Zbtb7b locus. (c) Thymocytes from Gata3+/+ AND TCR transgenic mice or from non TCR-transgenic Gata3ΔDP mice were subjected to ChIP with a monoclonal antibody against Gata3 or an isotype-matched control antibody. Immunoprecipitates were analyzed by PCR using primers specific for Zbtb7b sites A and B, for the CD8α E8(I) enhancer, and for an irrelevant sequence from the Gapdh gene. The specificity of amplification was verified by agarose gel electrophoresis. (d) Amounts of immunoprecipitated DNA were quantified using Sybr Green qPCR and are expressed as fold enrichment relative to Gapdh, evaluated for each site x as 2[(CGata3xCIgG1x)(CGata3GapdhCIgG1Gapdh)], where CGata3x and CIgG1x are the number of cycles for detection of target x in anti-Gata3 or control immunoprecipitates, respectively. The graph shows results from three distinct immunoprecipitations from Gata3+/+ AND TCR transgenic thymocytes, each from a distinct chromatin preparation; each symbol refers to data acquired within a single experiment. Horizontal bars indicate mean values for each site.

Comment in

Similar articles

Cited by

References

    1. Starr TK, Jameson SC, Hogquist KA. Positive and negative selection of T cells. Annu Rev Immunol. 2003;21:139–176. - PubMed
    1. Bosselut R. CD4/CD8-lineage differentiation in the thymus: from nuclear effectors to membrane signals. Nat Rev Immunol. 2004;4:529–540. - PubMed
    1. Laky K, Fowlkes B. Receptor signals and nuclear events in CD4 and CD8 T cell lineage commitment. Curr Opin Immunol. 2005;17:116–121. - PubMed
    1. He X, et al. The zinc finger transcription factor Th-POK regulates CD4 versus CD8 T-cell lineage commitment. Nature. 2005;433:826–833. - PubMed
    1. Sun G, et al. The zinc finger protein cKrox directs CD4 lineage differentiation during intrathymic T cell positive selection. Nat Immunol. 2005;6:373–381. - PubMed

Publication types

MeSH terms