. 2008 Oct;40(10):1199-203.
doi: 10.1038/ng.236. Epub 2008 Sep 7.

Systematic assessment of copy number variant detection via genome-wide SNP genotyping

Affiliations

Systematic assessment of copy number variant detection via genome-wide SNP genotyping

Gregory M Cooper et al. Nat Genet. 2008 Oct.

Abstract

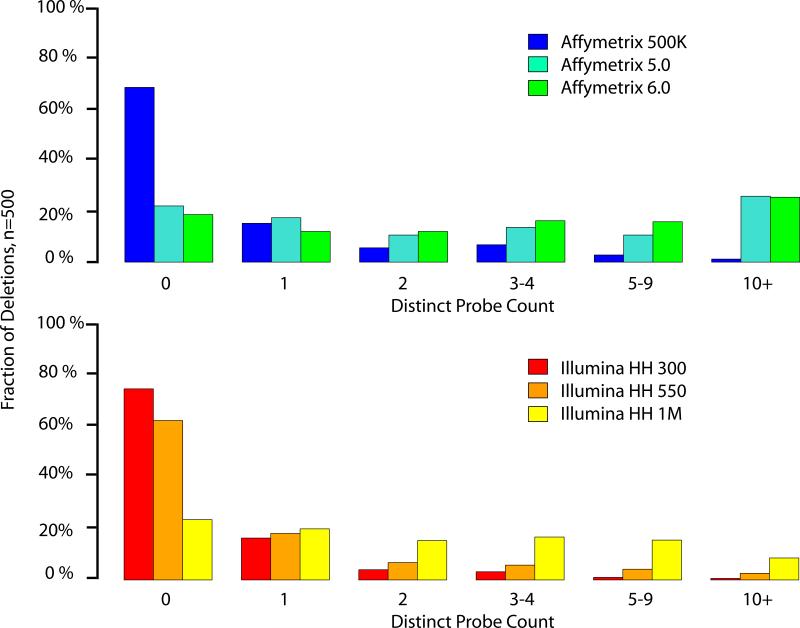
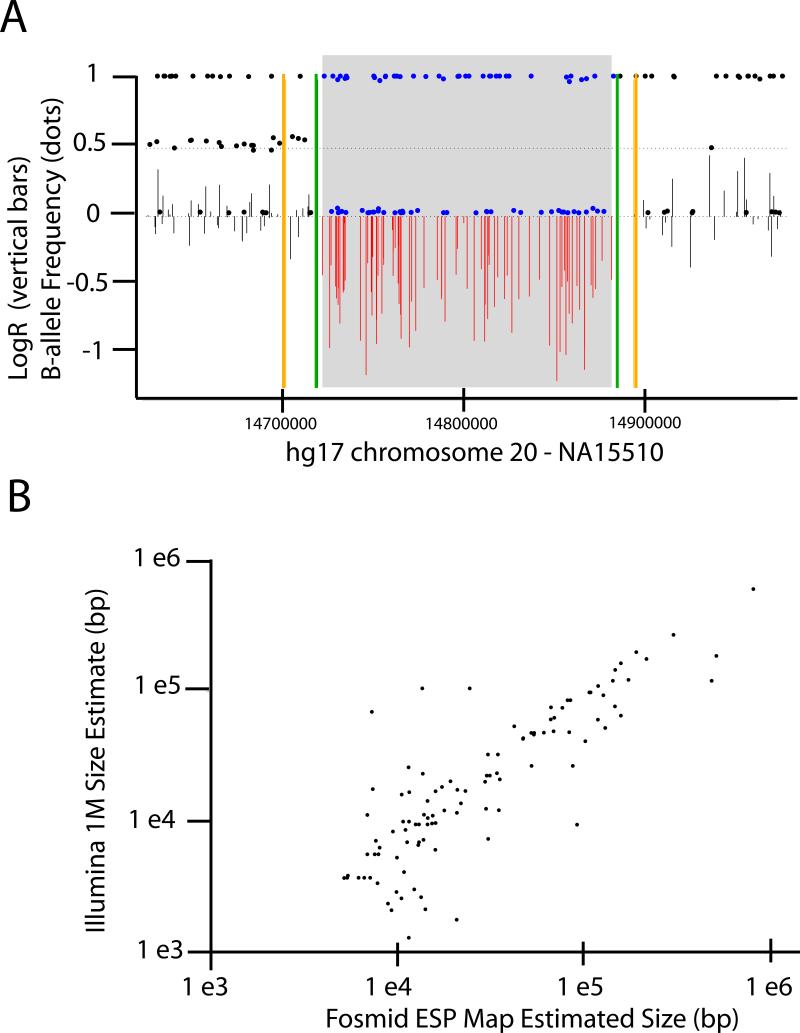
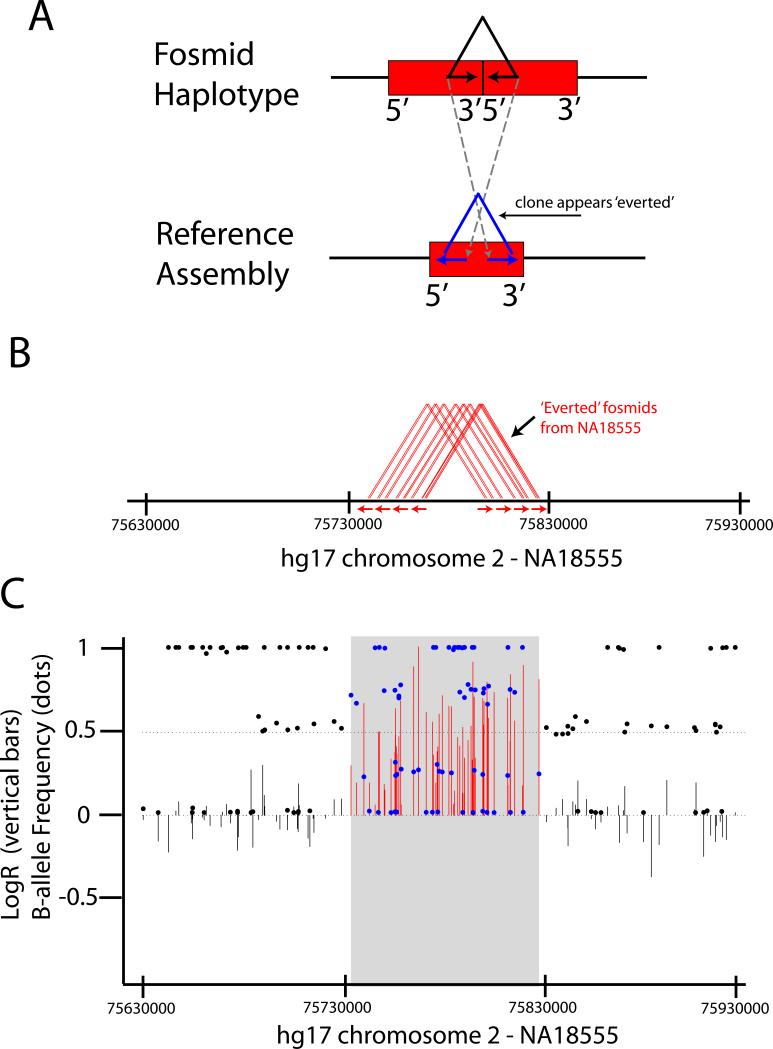
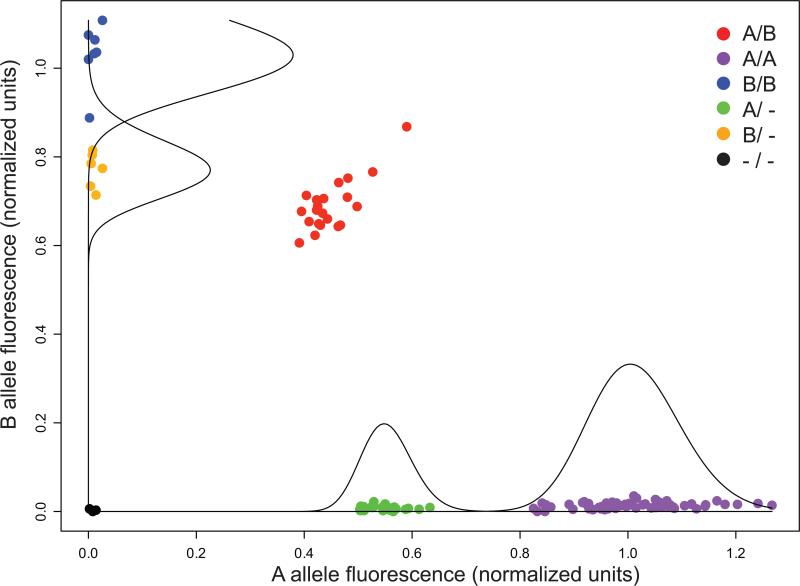
SNP genotyping has emerged as a technology to incorporate copy number variants (CNVs) into genetic analyses of human traits. However, the extent to which SNP platforms accurately capture CNVs remains unclear. Using independent, sequence-based CNV maps, we find that commonly used SNP platforms have limited or no probe coverage for a large fraction of CNVs. Despite this, in 9 samples we inferred 368 CNVs using Illumina SNP genotyping data and experimentally validated over two-thirds of these. We also developed a method (SNP-Conditional Mixture Modeling, SCIMM) to robustly genotype deletions using as few as two SNP probes. We find that HapMap SNPs are strongly correlated with 82% of common deletions, but the newest SNP platforms effectively tag about 50%. We conclude that currently available genome-wide SNP assays can capture CNVs accurately, but improvements in array designs, particularly in duplicated sequences, are necessary to facilitate more comprehensive analyses of genomic variation.


Figures

Figure 1
Figure 1
Probe coverage histogram for 500 non-redundant deletion events greater than 1 kb in size discovered in nine human samples by fosmid ESP placements and refined using oligonucleotide array-CGH experiments. We analyzed three array platforms available from Affymetrix (top) and Illumina (bottom). ‘Distinct’ probes correspond to each distinct location in the genome (hg17) physically represented on the array and internal to the annotated deletion breakpoints (physically redundant probes for a given location are not counted).
Figure 2
Figure 2
Deletion predictions validated by fosmid ESP placement data. a. Example of a deletion event inferred using Illumina Human 1M data. Intensity data for all probes in the indicated genomic interval (X-axis) for sample NA15510 (aka ‘G248’) are plotted. ‘LogR Ratio’ and ‘B-allele Frequency’ are plotted as vertical bars and filled dots, respectively. The gray box indicates the deletion span inferred by segmentation of the SNP data; probes internal to this box are colored red (‘LogR Ratio’) or blue (‘B-allele Frequency’). Green vertical bars indicate the deletion borders defined by complete fosmid re-sequencing. b. Correlation in size estimates between deletions inferred from SNP genotyping data (Y-axis) that overlap deletions annotated by fosmid ESP mapping (X-axis). Both axes are log-scaled.
Figure 3
Figure 3
Amplification events validated by clusters of ‘everted’ fosmid ESP placements. a. Consider a block of sequence (red bar) that is unique in the reference assembly (bottom portion) but tandemly duplicated in the haplotype of interest (top portion). In principle, for clones that span the breakpoint of this duplication, the end sequences will be inverted when aligned to the reference assembly such that they are oriented away from the center of the clone. Note that this should occur at all such duplication breakpoints, regardless of duplication size. b. We identified 233 sites in the nine fosmid libraries harboring multiple overlapping ‘everted’ clones, one of which is shown here. This site is supported by eight distinct clones (red triangles), each of which has reads oriented outwards as indicated by the underlying red arrows. c. Illumina Human 1M data for the same region in the same sample (X-axes are identical) is shown, with LogR and B-allele Frequency plotted as vertical bars and dots, respectively (similar to Figure 2A). The gray box corresponds to the duplication interval inferred by segmentation of the SNP data.
Figure 4
Figure 4
Example of fluorescence intensity measurements for each of 126 samples for a single SNP probe (rs10076425). These data are used by SCIMM (SNP-Conditional Mixture Modeling) to automatically determine insertion/deletion genotypes (see Methods). The genotype for each sample is denoted by color as indicated in the legend. Mixture component distributions are represented by superimposed curves on both the X and Y-axes. In this case, insertion/deletion status is computed by analyzing this probe in conjunction with four additional probes within a deleted region at chr4:10070382−10076653 (Supplementary Data S3).

Similar articles

Cited by

References

    1. Sebat J, et al. Large-scale copy number polymorphism in the human genome. Science. 2004;305:525–8. - PubMed
    1. Tuzun E, et al. Fine-scale structural variation of the human genome. Nat Genet. 2005;37:727–32. - PubMed
    1. Redon R, et al. Global variation in copy number in the human genome. Nature. 2006;444:444–54. - PMC - PubMed
    1. Kidd JM, et al. Mapping and sequencing of structural variation from eight human genomes. Nature. 2008;453:56–64. - PMC - PubMed
    1. Cooper GM, Nickerson DA, Eichler EE. Mutational and selective effects on copy-number variants in the human genome. Nat Genet. 2007;39:S22–9. - PubMed

Publication types