. 2008 Sep 8;3(9):e3165.
doi: 10.1371/journal.pone.0003165.

CCL3L1-CCR5 genotype improves the assessment of AIDS Risk in HIV-1-infected individuals

Affiliations

CCL3L1-CCR5 genotype improves the assessment of AIDS Risk in HIV-1-infected individuals

Hemant Kulkarni et al. PLoS One. .

Abstract

Background: Whether vexing clinical decision-making dilemmas can be partly addressed by recent advances in genomics is unclear. For example, when to initiate highly active antiretroviral therapy (HAART) during HIV-1 infection remains a clinical dilemma. This decision relies heavily on assessing AIDS risk based on the CD4+ T cell count and plasma viral load. However, the trajectories of these two laboratory markers are influenced, in part, by polymorphisms in CCR5, the major HIV coreceptor, and the gene copy number of CCL3L1, a potent CCR5 ligand and HIV-suppressive chemokine. Therefore, we determined whether accounting for both genetic and laboratory markers provided an improved means of assessing AIDS risk.

Methods and findings: In a prospective, single-site, ethnically-mixed cohort of 1,132 HIV-positive subjects, we determined the AIDS risk conveyed by the laboratory and genetic markers separately and in combination. Subjects were assigned to a low, moderate or high genetic risk group (GRG) based on variations in CCL3L1 and CCR5. The predictive value of the CCL3L1-CCR5 GRGs, as estimated by likelihood ratios, was equivalent to that of the laboratory markers. GRG status also predicted AIDS development when the laboratory markers conveyed a contrary risk. Additionally, in two separate and large groups of HIV+ subjects from a natural history cohort, the results from additive risk-scoring systems and classification and regression tree (CART) analysis revealed that the laboratory and CCL3L1-CCR5 genetic markers together provided more prognostic information than either marker alone. Furthermore, GRGs independently predicted the time interval from seroconversion to CD4+ cell count thresholds used to guide HAART initiation.

Conclusions: The combination of the laboratory and genetic markers captures a broader spectrum of AIDS risk than either marker alone. By tracking a unique aspect of AIDS risk distinct from that captured by the laboratory parameters, CCL3L1-CCR5 genotypes may have utility in HIV clinical management. These findings illustrate how genomic information might be applied to achieve practical benefits of personalized medicine.


Conflict of interest statement

Competing Interests: The authors have declared that no competing interests exist.

Figures

Figure 1
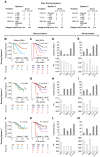
Figure 1. Prognostic performance of the CCL3L1-CCR5 GRGs in risk-scoring systems.
Panel A shows the three risk-scoring systems based on baseline CD4+ T cell counts (C), viral load (V) and GRGs (G) in the seroconverting and separately in the seroprevalent component of the WHMC HIV+ cohort. Panels B–C, F–G and J–K depict Kaplan Meier (KM) plots for progression to AIDS (1987 criteria) before and after accounting for the GRGs in the risk-scoring systems indicated on the left axis. The critical ratio χ2 values are indicated within the KM plots. Panels D, H and L depict likelihood ratio χ2 and AIC estimates in seroconverters, and panels E, I and M depict the same estimates for the seroprevalent subjects.
Figure 2
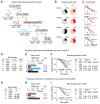
Figure 2. Classification trees and their application in the seroconverting component of the WHMC HIV+ cohort.
(A) A binary decision tree derived by CART analysis for the risk of developing AIDS (1987 criteria) based on baseline CD4+ T cell counts, viral load (VL) and GRG status in the seroconverting component of the WHMC HIV+ cohort. The analysis identified five exclusive groups designated as Groups A to E. The tree shows that the proximal split was based on the CD4 cell count, and the CART analysis generated the cut-off to be 453 cells/mm3. The next split was based on a viral load of 17,500 copies/ml. The third split was based on GRG status, followed by another split at a viral load of 55,500 copies/ml. The five groups generated are color-coded and the number of subjects in each of these groups is shown along with their proportion in the study group. The values in brackets ([ ]) indicate the relative hazard estimates corresponding to each of these groups as shown in Figure 2F. (B) Pie charts depicting the proportion of subjects in each of the splits who did or did not develop AIDS (1987 criteria). Within each pie-chart, the dark pie-slice represents the proportion of subjects who developed AIDS. Yes and no refers to whether a subject does or does not categorize, respectively, to the indicated node. (C) KM plots for the rate of progression to AIDS from time of seroconversion based on the split at each corresponding node in the decision tree shown in panel A. The significance values shown below each KM plot were estimated using the logrank test. (D–F) Association between the five risk groups (panel D) generated by CART and the risk (panel E) and rate of developing AIDS (panel F). Panel D defines the risk groups based on the baseline CD4 (cells/mm3), steady state viral load (k, ×1,000 copies/ml), and GRG status (M/H, moderate or high GRG; Low, low GRG). Gp, group. Panel E shows the probability (Prob) of developing AIDS within each risk group generated by CART analysis. “Overall” refers to the probability of developing AIDS in the seroconverting component of the cohort without accounting for the laboratory or genetic markers. ΔP, change in probability from the overall probability. Panel F shows the KM plots for rate of progression to AIDS for the five groups of subjects identified by CART. The table to the right shows the relative hazards (RH) corresponding to these five groups estimated by using Cox proportional hazards models. In these analyses, the reference category (RH = 1) is group B, which denotes subjects that have a CD4 of ≥453 cells/mm3 and a viral load of <17,500 copies/ml. The results show that relative to this reference category, groups A, C and E are associated with a significantly increased risk of progressing rapidly to AIDS. (G–I) Similar analyses to those shown in panels D to F but using risk groups in which the GRGs are not included as prognosticators. In these analyses, the risk groups A and B shown in panel A and panel D were used along with two new groups designated as group F and group G. The latter two groups were derived from the Groups C to E shown in panel D by not accounting for the GRG status and dichotomizing the cohort further based on a viral load cut-off of 55,500 copies/ml. Reference category (RH = 1) is group B. In panels E and H, prob refers to probability.
Figure 3
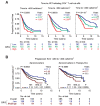
Figure 3. CCL3L1-CCR5 GRGs influence median time-from-seroconversion to CD4 cell count thresholds that might be used to guide initiation of HAART, and time from a high to a low CD4 cell count.
In Panel A, KM plots show the time-from-seroconversion to arrival at <450 (left), <350 (center) or <200 (right) CD-cells/mm3. In Panel B, the KM plots are for progression from <450 to <200 CD4-cells/mm3 in all seroconverters (left) or seroconverters recruited and followed during the years 1990 to 1999, a time-period in which antiretroviral therapy was available (right). The color codes for the KM plots in panel B are: blue, low GRG; brown, moderate and high GRGs combined into a single category; and black, all subjects. Overall P values are at the top of each plot. Color-coded numbers at the upper right of the KM plots represent the median time-to-event, that is, from seroconversion to the indicated CD4 cell count. In panel A, P values for differences in median time-to-event relative to those with a low GRG were: *, 0.1131; †, 0.0089; ‡, 0.0030; §, 0.0005; ¶, 0.0001; and ∥, 9.6×10⁻⁷. RH, relative hazard; CI, confidence interval. P values in Panel B are adjusted for the steady-state viral load, baseline CD4 and best DTH response recorded during disease course, and subjects with a moderate or high GRG were combined into a single category.

References

    1. Lederman MM, Penn-Nicholson A, Cho M, Mosier D. Biology of CCR5 and its role in HIV infection and treatment. Jama. 2006;296:815–826. - PubMed
    1. Townson JR, Barcellos LF, Nibbs RJ. Gene copy number regulates the production of the human chemokine CCL3-L1. Eur J Immunol. 2002;32:3016–3026. - PubMed
    1. Menten P, Struyf S, Schutyser E, Wuyts A, De Clercq E, et al. The LD78beta isoform of MIP-1alpha is the most potent CCR5 agonist and HIV-1-inhibiting chemokine. J Clin Invest. 1999;104:R1–5. - PMC - PubMed
    1. Xin X, Shioda T, Kato A, Liu H, Sakai Y, et al. Enhanced anti-HIV-1 activity of CC-chemokine LD78beta, a non-allelic variant of MIP-1alpha/LD78alpha. FEBS Lett. 1999;457:219–222. - PubMed
    1. Gonzalez E, Kulkarni H, Bolivar H, Mangano A, Sanchez R, et al. The influence of CCL3L1 gene-containing segmental duplications on HIV-1/AIDS susceptibility. Science. 2005;307:1434–1440. - PubMed

Publication types