

D1-arginine257 mutants (R257E, K, and Q) of Chlamydomonas reinhardtii have a lowered QB redox potential: analysis of thermoluminescence and fluorescence measurements
- PMID: 18777103
- PMCID: PMC2978033
- DOI: 10.1007/s11120-008-9351-9
D1-arginine257 mutants (R257E, K, and Q) of Chlamydomonas reinhardtii have a lowered QB redox potential: analysis of thermoluminescence and fluorescence measurements
Abstract
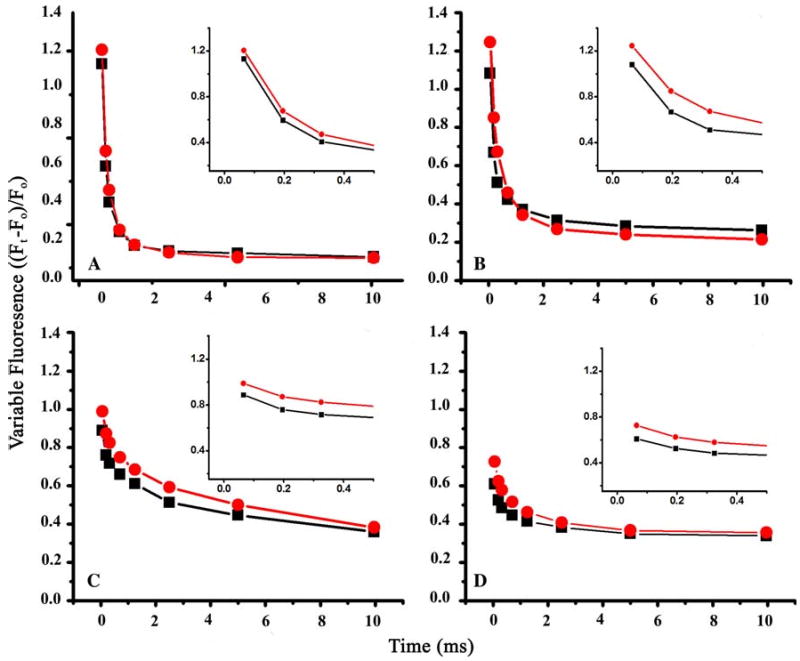
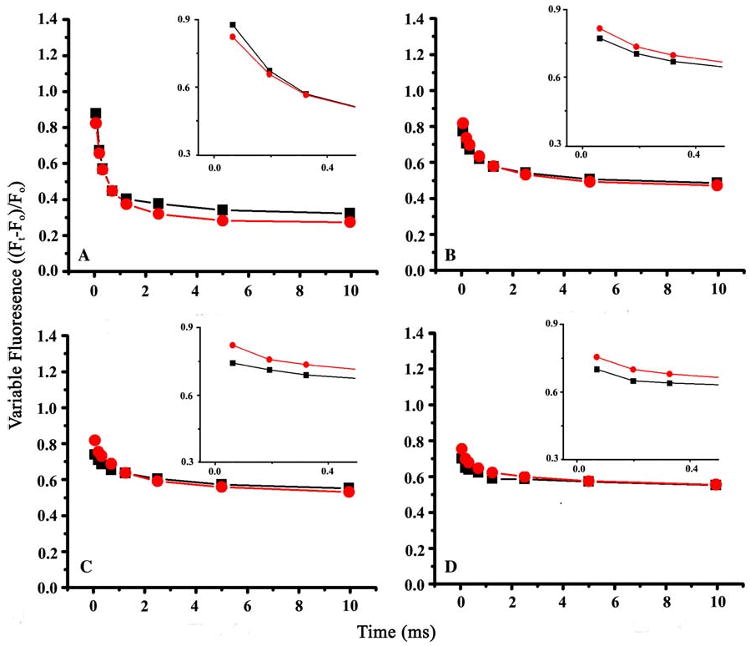
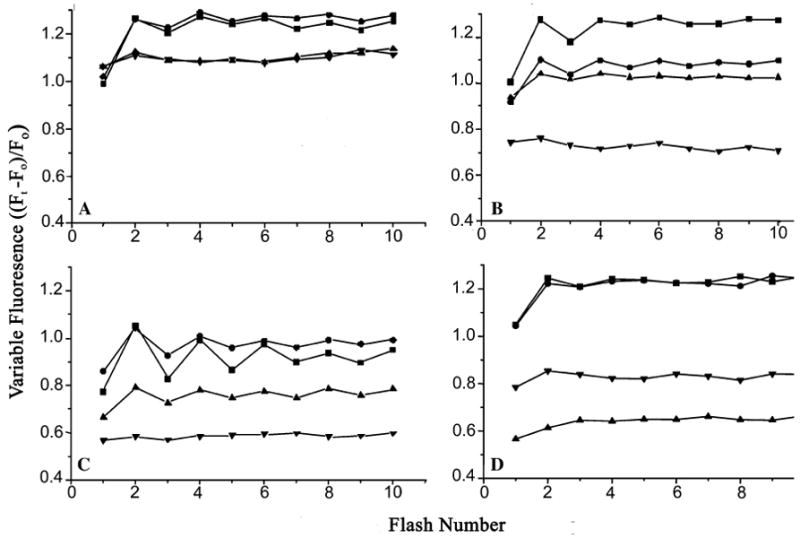
Arginine257 (R257), in the de-helix that caps the Q(B) site of the D1 protein, has been shown by mutational studies to play a key role in the sensitivity of Photosystem II (PS II) to bicarbonate-reversible binding of the formate anion. In this article, the role of this residue has been further investigated through D1 mutations (R257E, R257Q, and R257K) in Chlamydomonas reinhardtii. We have investigated the activity of the Q(B) site by studying differences from wild type on the steady-state turnover of PS II, as assayed through chlorophyll (Chl) a fluorescence yield decay after flash excitation. The effects of p-benzoquinone (BQ, which oxidizes reduced Q(B), Q(B)(-) ) and 3-(3,4-dichlorophenyl)-1,1-dimethylurea (DCMU, which blocks electron flow from Q(A)(-) to Q(B)) were measured. The equilibrium constants of the two-electron gate were obtained through thermoluminescence measurements. The thermoluminescence properties were changed in the mutants, especially when observed after pretreatment with 100 microM BQ. A theoretical analysis of the thermoluminescence data, based mainly on the recombination pathways model of Rappaport et al. (2005), led to the conclusion that the free-energy difference for the recombination of Q(B)(-) with S(2) was reduced by 20-40 mV in the three mutants (D1-R257K, D1-R257Q, and D1-R257E); this was interpreted to be due to a lowering of the redox potential of Q(B)/Q(B)(-). Further, since the recombination of Q(A)(-) with S(2) was unaffected, we suggest that no significant change in redox potential of Q(A)/Q(A)(-) occurred in these three mutants. The maximum variable Chl a fluorescence yield is lowered in the mutants, in the order R257K > R257Q > R257E, compared to wild type. Our analysis of the binary oscillations in Chl a fluorescence following pretreatment of cells with BQ showed that turnover of the Q(B) site was relatively unaffected in the three mutants. The mutant D1-R257E had the lowest growth rate and steady-state activity and showed the weakest binary oscillations. We conclude that the size and the charge of the amino acid at the position D1-257 play a role in PS II function by modulating the effective redox potential of the Q(B)/Q(B)(-) pair. We discuss an indirect mechanism mediated through electrostatic and/or surface charge effects and the possibility of more pleiotropic effects arising from decreased stability of the D1/D2 and D1/CP47 interfaces.
Figures


Similar articles
-
Loss of inhibition by formate in newly constructed photosystem II D1 mutants, D1-R257E and D1-R257M, of Chlamydomonas reinhardtii.Biochim Biophys Acta. 1998 Jul 20;1365(3):473-91. doi: 10.1016/s0005-2728(98)00101-7. Biochim Biophys Acta. 1998. PMID: 9711300
-
Modification of the photosystem II acceptor side function in a D1 mutant (arginine-269-glycine) of Chlamydomonas reinhardti.Biochim Biophys Acta. 1997 Nov 10;1322(1):60-76. doi: 10.1016/s0005-2728(97)00063-7. Biochim Biophys Acta. 1997. PMID: 9398079
-
Acetate in mixotrophic growth medium affects photosystem II in Chlamydomonas reinhardtii and protects against photoinhibition.Biochim Biophys Acta. 2013 Oct;1827(10):1183-90. doi: 10.1016/j.bbabio.2013.06.004. Epub 2013 Jun 17. Biochim Biophys Acta. 2013. PMID: 23791666
-
Modulating the redox potential of the stable electron acceptor, Q(B), in mutagenized photosystem II reaction centers.Biochemistry. 2011 Mar 8;50(9):1454-64. doi: 10.1021/bi1017649. Epub 2011 Feb 10. Biochemistry. 2011. PMID: 21235277
-
Radiative and non-radiative charge recombination pathways in Photosystem II studied by thermoluminescence and chlorophyll fluorescence in the cyanobacterium Synechocystis 6803.Biochim Biophys Acta. 2007 Mar;1767(3):233-43. doi: 10.1016/j.bbabio.2007.01.022. Epub 2007 Feb 7. Biochim Biophys Acta. 2007. PMID: 17349965
Cited by
-
Govindjee at 80: more than 50 years of free energy for photosynthesis.Photosynth Res. 2013 Oct;116(2-3):111-44. doi: 10.1007/s11120-013-9921-3. Epub 2013 Oct 10. Photosynth Res. 2013. PMID: 24113923
-
A sixty-year tryst with photosynthesis and related processes: an informal personal perspective.Photosynth Res. 2019 Mar;139(1-3):15-43. doi: 10.1007/s11120-018-0590-0. Epub 2018 Oct 20. Photosynth Res. 2019. PMID: 30343396
-
Fourier transform infrared (FTIR) spectroscopy.Photosynth Res. 2009 Aug-Sep;101(2-3):157-70. doi: 10.1007/s11120-009-9439-x. Epub 2009 Jun 10. Photosynth Res. 2009. PMID: 19513810 Review.
-
Electron transport in Tradescantia leaves acclimated to high and low light: thermoluminescence, PAM-fluorometry, and EPR studies.Photosynth Res. 2020 Dec;146(1-3):123-141. doi: 10.1007/s11120-020-00767-2. Epub 2020 Jun 27. Photosynth Res. 2020. PMID: 32594291
-
Photosystem-II D1 protein mutants of Chlamydomonas reinhardtii in relation to metabolic rewiring and remodelling of H-bond network at QB site.Sci Rep. 2018 Oct 3;8(1):14745. doi: 10.1038/s41598-018-33146-y. Sci Rep. 2018. PMID: 30283151 Free PMC article.
References
-
- Bowyer J, Hilton M, Whitelegge J, Jewess P, Camilleri P, Crofts A, et al. Molecular modeling studies on the binding of phenylurea inhibitors to the D1 protein of Photosystem II. Z Naturforsch. 1990;45c:379–387. - PubMed
Publication types
MeSH terms
Substances
Grants and funding
LinkOut - more resources
Full Text Sources
Miscellaneous
