

Characterization of the recognition and functional heterogeneity exhibited by cytokine-induced killer cell subsets against acute myeloid leukaemia target cell
- PMID: 18778291
- PMCID: PMC2669823
- DOI: 10.1111/j.1365-2567.2008.02910.x
Characterization of the recognition and functional heterogeneity exhibited by cytokine-induced killer cell subsets against acute myeloid leukaemia target cell
Abstract
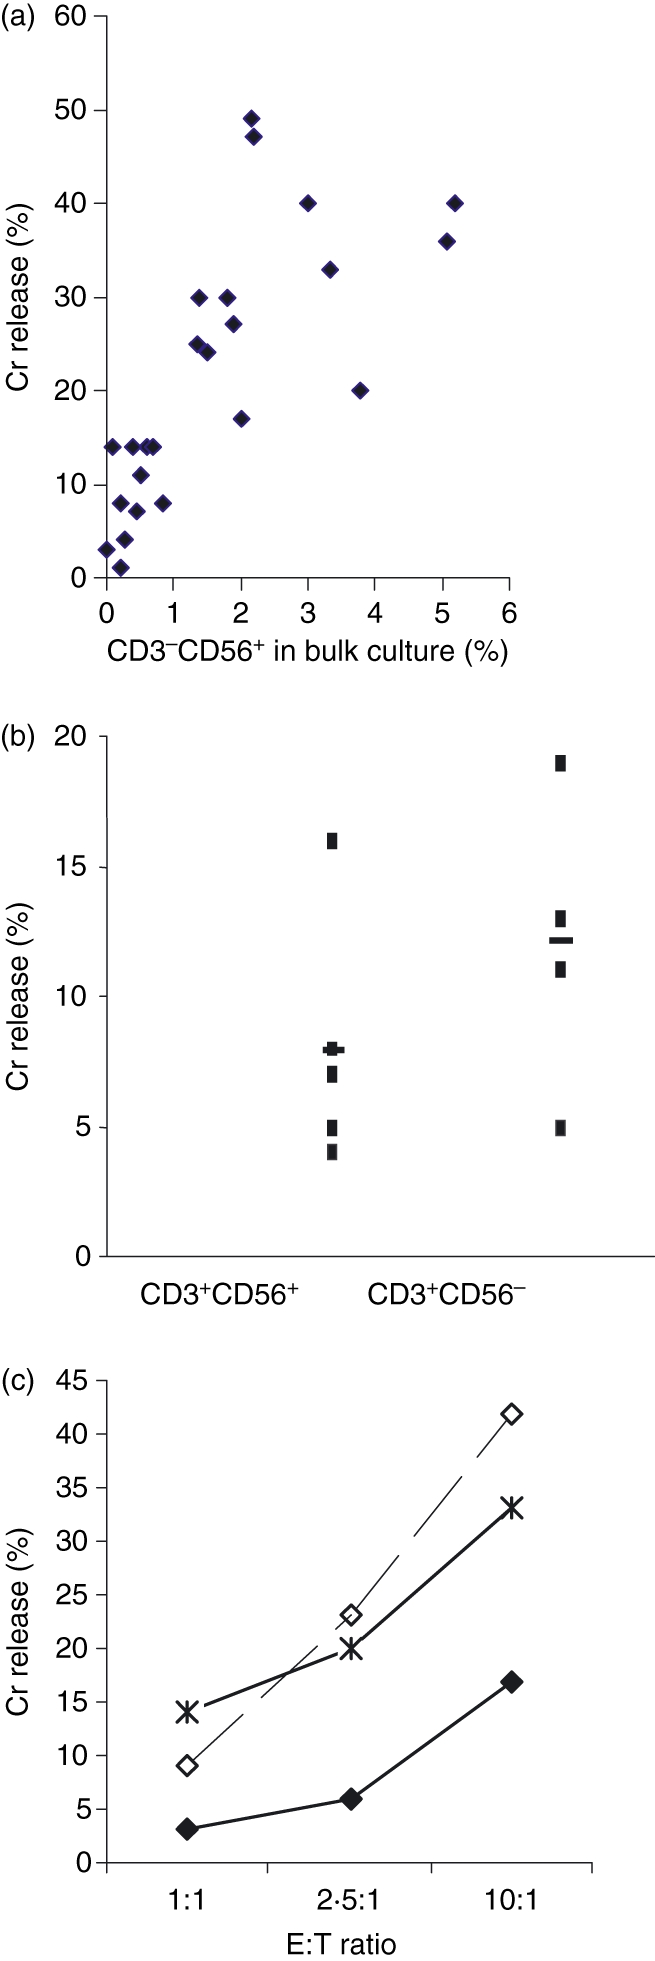
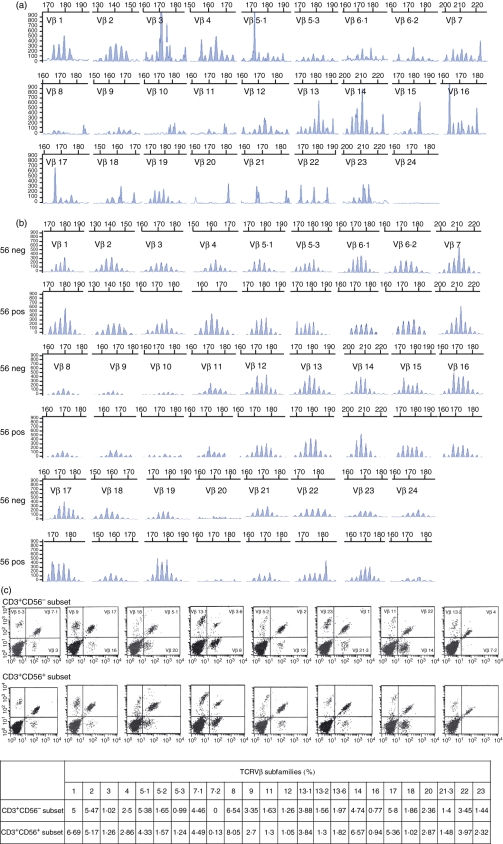
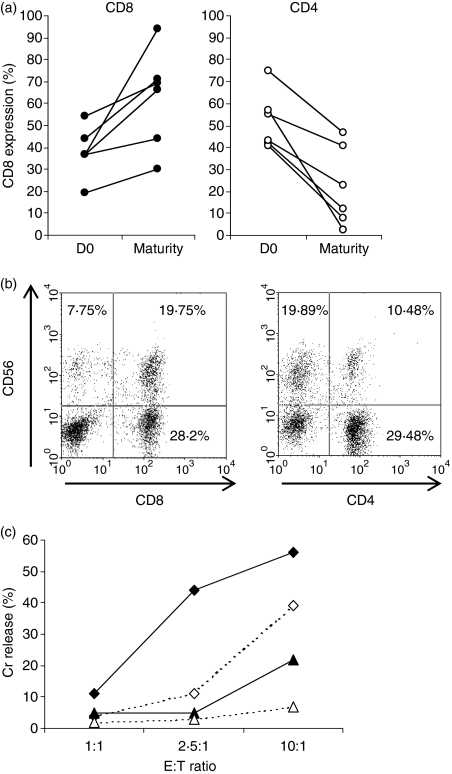
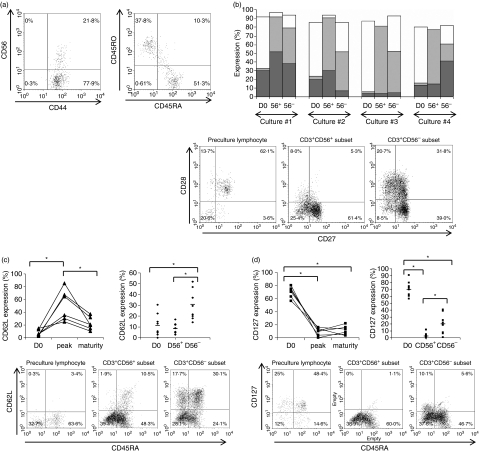
The polyclonal cytokine-induced killer (CIK) cells exhibit potent cytotoxicity against a variety of tumour cells including autologous and allogeneic acute myeloid leukaemic (AML) targets. At maturity, three lymphocyte subsets: CD3(-) CD56(+), CD3(+) CD56(-) and CD3(+) CD56(+), constitute the bulk of the CIK cell culture. The CD3(-) CD56(+) subset behaves like classical natural killer (NK) cells where cytotoxicity is potentiated by blocking the human leucocyte antigen Class I molecules in the AML targets. Both the CD3(+) CD56(+) and CD3(+) CD56(-) subsets, though known to kill autologous and allogeneic targets to a comparable degree and therefore non-major histocompatibility complex (MHC)-restricted, nevertheless require the presence of the MHC molecule on the target, which interacts with their CD3-T-cell receptor complex. Although CIK cells are often termed 'NK-like' T cells, we have demonstrated that the well-characterized NK receptors KIR, NKG2C/E, NKG2D and DNAM-1 are not involved in the process of AML recognition for the CD3(+) CD56(-) and CD3(+) CD56(+) subsets. The CD3(+) CD56(+) and CD3(+) CD56(-) subsets express a polyclonal and comparable TCRVbeta repertoire in a Gaussian distribution. The CD3(+) CD56(+) subset kills AML targets more efficiently than its CD3(+) CD56(-) counterpart because of the presence of a higher proportion of CD8(+) cells. The CD3(+) CD56(+) subset comprise more terminally differentiated late effector T cells that bear the CD27(+) CD28(-) or CD27(-) CD28(-) phenotype, with a higher granzyme A content. In comparison, the phenotype of the CD3(+) CD56(-) subset is consistent with early effector T cells that are CD27(+) CD28(+) and CD62L(+), known to be less cytotoxic but possess greater proliferative potential.
Figures
 ). Figure represents one of the two comparison sets done, P < 0·05 for both.
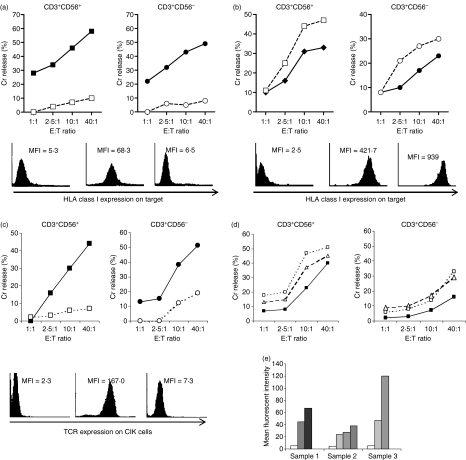
 ), 60 min (
 ), 120 min (
 ), 240 min (▀).
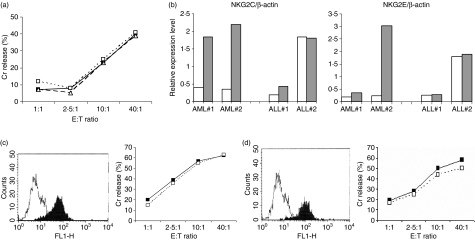

 ) and late CD27− CD28− TE-cell subsets (
 ) present in the starting population (D0), within the CD3+ CD56+ (56+) and CD3+ CD56− (56−) subsets in the matured cytokine-induced killer (CIK) cell culture. Cultures #1 to #4 represent four separate CIK cell cultures of four patients with acute myeloid leukaemia (AML; bar chart). The dot plot shows the fluorescence-activated cell sorting (FACS) profiles of a representative culture, sample #2. (c) Level of CD62L expression on T cells before culture (D0), at the peak of expression (D15–23), and at maturity of CIK cell culture (D25–30) for six separate CIK cell cultures of six AML patients. Expression of CD62L at maturity was higher in the CD3+ CD56− subset than in CD3+ CD56+ subset (upper panel). The lower panel shows the FACS profiles of a representative culture sample. *Indicates statistical significance at P < 0·05 by two-way paired Student’s t-test. (d) Level of CD127 expression on T cells before culture (D0), at the peak of expression (D15–23), and at maturity of CIK cell culture (D25–30) for six separate CIK cell cultures of six AML patients. CD127 was dimly expressed at variable levels in the CD3+ CD56− subset at maturity but absent in CD3+ CD56+ subset (upper panel). The lower panel shows the FACS profiles of a representative culture sample. *Indicates statistical significance at P < 0·05 by two-way paired Student’s t-test.
Similar articles
-
Dual-functional capability of CD3+CD56+ CIK cells, a T-cell subset that acquires NK function and retains TCR-mediated specific cytotoxicity.Blood. 2011 Sep 22;118(12):3301-10. doi: 10.1182/blood-2011-02-336321. Epub 2011 Aug 5. Blood. 2011. PMID: 21821703
-
Cytokine-induced killer cells: NK-like T cells with cytotolytic specificity against leukemia.Leuk Lymphoma. 2003 Sep;44(9):1457-62. doi: 10.3109/10428190309178764. Leuk Lymphoma. 2003. PMID: 14565644 Review.
-
The dual-functional capability of cytokine-induced killer cells and application in tumor immunology.Hum Immunol. 2015 May;76(5):385-91. doi: 10.1016/j.humimm.2014.09.021. Epub 2014 Oct 8. Hum Immunol. 2015. PMID: 25305457 Review.
-
Expansion of Philadelphia chromosome-negative CD3(+)CD56(+) cytotoxic cells from chronic myeloid leukemia patients: in vitro and in vivo efficacy in severe combined immunodeficiency disease mice.Blood. 1998 Nov 1;92(9):3318-27. Blood. 1998. PMID: 9787169
-
A novel mechanism of antitumor response involving the expansion of CD3+/CD56+ large granular lymphocytes triggered by a tumor-expressed activating ligand.Leukemia. 2002 May;16(5):855-60. doi: 10.1038/sj.leu.2402488. Leukemia. 2002. PMID: 11986947
Cited by
-
Cytokine-induced killer cells: A novel immunotherapy strategy for leukemia.Oncol Lett. 2015 Feb;9(2):535-541. doi: 10.3892/ol.2014.2780. Epub 2014 Dec 8. Oncol Lett. 2015. PMID: 25621022 Free PMC article.
-
Immunophenotype and antitumor activity of cytokine-induced killer cells from patients with hepatocellular carcinoma.PLoS One. 2023 Jan 4;18(1):e0280023. doi: 10.1371/journal.pone.0280023. eCollection 2023. PLoS One. 2023. PMID: 36598909 Free PMC article.
-
Innovative Clinical Perspectives for CIK Cells in Cancer Patients.Int J Mol Sci. 2018 Jan 25;19(2):358. doi: 10.3390/ijms19020358. Int J Mol Sci. 2018. PMID: 29370095 Free PMC article. Review.
-
SMAC Mimetic BV6 Enables Sensitization of Resistant Tumor Cells but also Affects Cytokine-Induced Killer (CIK) Cells: A Potential Challenge for Combination Therapy.Front Pediatr. 2014 Jul 18;2:75. doi: 10.3389/fped.2014.00075. eCollection 2014. Front Pediatr. 2014. PMID: 25101252 Free PMC article.
-
Cytokine-induced killer cells hunt individual cancer cells in droves in a mouse model.Cancer Immunol Immunother. 2017 Feb;66(2):193-202. doi: 10.1007/s00262-016-1934-2. Epub 2016 Nov 25. Cancer Immunol Immunother. 2017. PMID: 27888293 Free PMC article.
References
-
- Schmidt-Wolf IGH, Lefterova P, Johnston V, et al. Sensitivity of multidrug-resistant tumour cell lines to immunologic effector cells. Cell Immunol. 1996;169:85–90. - PubMed
-
- Lu PH, Negrin RS. A novel population of expanded human CD3+CD56+ cells derived from T cells with potent in vivo antitumor activity in mice with severe combined immunodeficiency. J Immunol. 1994;153:1687–96. - PubMed
-
- Linn YC, Lau LC, Hui KM. Generation of cytokine-induced killer cells from leukemic samples with in vitro cytotoxicity against autologous and allogeneic leukemic blasts. Br J Hematol. 2002;116:78–86. - PubMed
-
- Hoyle C, Bangs CD, Chang P, Kamel O, Mehta B, Negrin RS. Expansion of Philadelphia chromosome-negative CD3+CD56+ cytotoxic cells from chronic myeloid leukemia patients: in vitro and in vivo efficacy in severe combined immunodeficiency disease mice. Blood. 1998;92:3318–27. - PubMed
Publication types
MeSH terms
Substances
LinkOut - more resources
Full Text Sources
Medical
Research Materials
