. 2008 Sep 8:9:364.
doi: 10.1186/1471-2105-9-364.

Fregene: simulation of realistic sequence-level data in populations and ascertained samples

Affiliations

Fregene: simulation of realistic sequence-level data in populations and ascertained samples

Marc Chadeau-Hyam et al. BMC Bioinformatics. .

Abstract

Background: FREGENE simulates sequence-level data over large genomic regions in large populations. Because, unlike coalescent simulators, it works forwards through time, it allows complex scenarios of selection, demography, and recombination to be modelled simultaneously. Detailed tracking of sites under selection is implemented in FREGENE and provides the opportunity to test theoretical predictions and gain new insights into mechanisms of selection. We describe here main functionalities of both FREGENE and SAMPLE, a companion program that can replicate association study datasets.

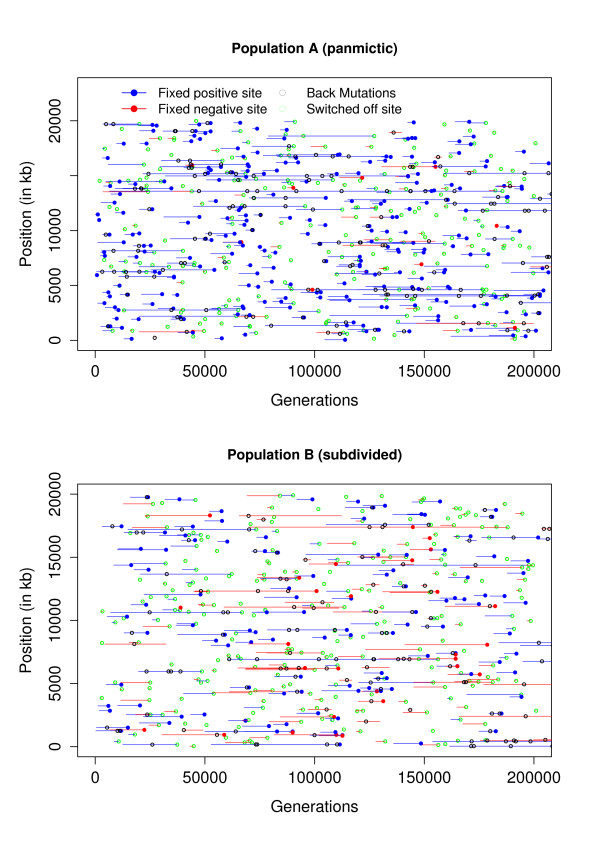
Results: We report detailed analyses of six large simulated datasets that we have made publicly available. Three demographic scenarios are modelled: one panmictic, one substructured with migration, and one complex scenario that mimics the principle features of genetic variation in major worldwide human populations. For each scenario there is one neutral simulation, and one with a complex pattern of selection.

Conclusion: FREGENE and the simulated datasets will be valuable for assessing the validity of models for selection, demography and population genetic parameters, as well as the efficacy of association studies. Its principle advantages are modelling flexibility and computational efficiency. It is open source and object-oriented. As such, it can be customised and the range of models extended.


Figures

Figure 1
Figure 1
Recombination rate (log scale) along the chromosome for populations A and B. Solid green and dotted blue vertical lines represent first and last position of regions and subregions respectively.
Figure 2
Figure 2
Evolution of the per-site diversity for the worldwide human simulation (population C). Solid lines: neutral model; dashed lines: model with selection. Vertical dotted lines apply to the selection model and indicate when a strongly selected site (s > 0.075) went to fixation. Note that, for visual clarity, the time axis is scaled differently for different steps of the simulation.
Figure 3
Figure 3
Evolution of the distribution of allele frequencies. Populations A (left) and B (right), simulated without (top) and with (bottom) selection. The mean proportion of sites within each allele frequency range, averaged over the final 100 k generations, is shown in parentheses.
Figure 4
Figure 4
Selected sites map. Lines indicate the life-spans of sites under selection that reached fixation for the derived allele in populations A (top) and B (bottom). Red and blue circles indicate time of fixation of, respectively, positively (s > 0) and negatively (s < 0) selected sites. Also shown are selected sites at which selection was switched off (green), and at which a back mutation occurred (black).
Figure 5
Figure 5
Distribution of selection coefficients and time under selection. The scatter plots show the s selection coefficient (x-axis) and the total time that the site remained polymorphic (y-axis), for all selected sites in populations A (top) and B (bottom). Red and blue indicates sites at which the derived allele reached fixation or was lost, respectively. The histograms show the distributions of s.

References

    1. Hoggart CJ, Chadeau-Hyam M, Clark TG, Lampariello R, De Iorio M, Whittaker JC, Balding DJ. Sequence-level population simulations over large genomic regions. Genetics. 2007;177:1725–1731. doi: 10.1534/genetics.106.069088. - DOI - PMC - PubMed
    1. Davies JL, Simancik F, Lyngso R, Mailund T, Hein J. On recombination-induced multiple and simultaneous coalescent events. Genetics. 2007;177:2151–2160. doi: 10.1534/genetics.107.071126. - DOI - PMC - PubMed
    1. Hey J. FPG – A computer program for forward population genetic simulation. 2004. http://lifesci.rutgers.edu/~heylab/heylabsoftware.htm#FPG
    1. Peng B, Kimmel M. simuPOP: a forward-time population genetics simulation environment. Bioinformatics. 2005;21:3686–7. doi: 10.1093/bioinformatics/bti584. - DOI - PubMed
    1. Schaffner S, Foo C, Gabriel S, Reich D, Daly M, Altshuler D. Calibrating a coalescent simulation of human genome sequence variation. Genome Research. 2005;15:1576–1583. doi: 10.1101/gr.3709305. - DOI - PMC - PubMed

Publication types