

The role of the humoral immune response in the molecular evolution of the envelope C2, V3 and C3 regions in chronically HIV-2 infected patients
- PMID: 18778482
- PMCID: PMC2563025
- DOI: 10.1186/1742-4690-5-78
The role of the humoral immune response in the molecular evolution of the envelope C2, V3 and C3 regions in chronically HIV-2 infected patients
Abstract
Background: This study was designed to investigate, for the first time, the short-term molecular evolution of the HIV-2 C2, V3 and C3 envelope regions and its association with the immune response. Clonal sequences of the env C2V3C3 region were obtained from a cohort of eighteen HIV-2 chronically infected patients followed prospectively during 2-4 years. Genetic diversity, divergence, positive selection and glycosylation in the C2V3C3 region were analysed as a function of the number of CD4+ T cells and the anti-C2V3C3 IgG and IgA antibody reactivity
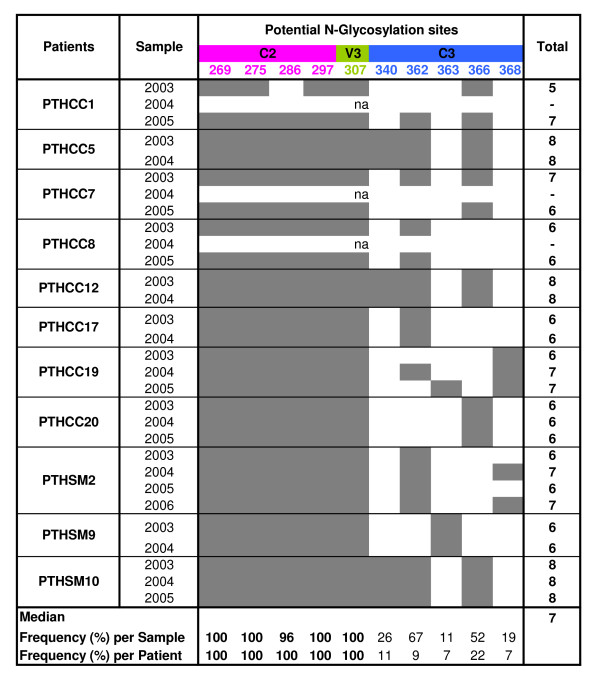
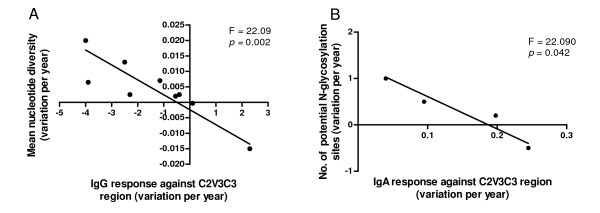
Results: The mean intra-host nucleotide diversity was 2.1% (SD, 1.1%), increasing along the course of infection in most patients. Diversity at the amino acid level was significantly lower for the V3 region and higher for the C2 region. The average divergence rate was 0.014 substitutions/site/year, which is similar to that reported in chronic HIV-1 infection. The number and position of positively selected sites was highly variable, except for codons 267 and 270 in C2 that were under strong and persistent positive selection in most patients. N-glycosylation sites located in C2 and V3 were conserved in all patients along the course of infection. Intra-host variation of C2V3C3-specific IgG response over time was inversely associated with the variation in nucleotide and amino acid diversity of the C2V3C3 region. Variation of the C2V3C3-specific IgA response was inversely associated with variation in the number of N-glycosylation sites.
Conclusion: The evolutionary dynamics of HIV-2 envelope during chronic aviremic infection is similar to HIV-1 implying that the virus should be actively replicating in cellular compartments. Convergent evolution of N-glycosylation in C2 and V3, and the limited diversification of V3, indicates that there are important functional constraints to the potential diversity of the HIV-2 envelope. C2V3C3-specific IgG antibodies are effective at reducing viral population size limiting the number of virus escape mutants. The C3 region seems to be a target for IgA antibodies and increasing N-linked glycosylation may prevent HIV-2 envelope recognition by these antibodies. Our results provide new insights into the biology of HIV-2 and its relation with the human host and may have important implications for vaccine design.
Figures
References
-
- Hu DJ, Dondero TJ, Rayfield MA, George JR, Schochetman G, Jaffe HW, Luo CC, Kalish ML, Weniger BG, Pau CP, et al. The emerging genetic diversity of HIV. The importance of global surveillance for diagnostics, research, and prevention. JAMA. 1996;275:210–216. doi: 10.1001/jama.275.3.210. - DOI - PubMed
-
- Andersson S, Norrgren H, da Silva Z, Biague A, Bamba S, Kwok S, Christopherson C, Biberfeld G, Albert J. Plasma viral load in HIV-1 and HIV-2 singly and dually infected individuals in Guinea-Bissau, West Africa: significantly lower plasma virus set point in HIV-2 infection than in HIV-1 infection. Arch Intern Med. 2000;160:3286–3293. doi: 10.1001/archinte.160.21.3286. - DOI - PubMed
Publication types
MeSH terms
Substances
Associated data
- Actions
- Actions
- Actions
- Actions
- Actions
- Actions
- Actions
- Actions
- Actions
- Actions
- Actions
- Actions
- Actions
- Actions
- Actions
- Actions
- Actions
- Actions
- Actions
- Actions
- Actions
- Actions
- Actions
- Actions
- Actions
- Actions
- Actions
- Actions
- Actions
- Actions
- Actions
- Actions
- Actions
- Actions
- Actions
- Actions
- Actions
- Actions
- Actions
- Actions
- Actions
- Actions
- Actions
- Actions
- Actions
- Actions
- Actions
- Actions
- Actions
- Actions
- Actions
- Actions
- Actions
- Actions
- Actions
- Actions
- Actions
- Actions
- Actions
- Actions
- Actions
- Actions
- Actions
- Actions
- Actions
- Actions
- Actions
- Actions
- Actions
- Actions
- Actions
- Actions
- Actions
- Actions
- Actions
- Actions
- Actions
- Actions
- Actions
- Actions
- Actions
- Actions
- Actions
- Actions
- Actions
- Actions
- Actions
- Actions
- Actions
- Actions
- Actions
- Actions
- Actions
- Actions
- Actions
- Actions
- Actions
- Actions
- Actions
- Actions
- Actions
- Actions
- Actions
- Actions
- Actions
- Actions
- Actions
- Actions
- Actions
- Actions
- Actions
- Actions
- Actions
- Actions
- Actions
- Actions
- Actions
- Actions
- Actions
- Actions
- Actions
- Actions
- Actions
- Actions
- Actions
- Actions
- Actions
- Actions
- Actions
- Actions
- Actions
- Actions
- Actions
- Actions
- Actions
- Actions
- Actions
- Actions
- Actions
- Actions
- Actions
- Actions
- Actions
- Actions
- Actions
- Actions
- Actions
- Actions
- Actions
- Actions
- Actions
- Actions
- Actions
- Actions
- Actions
- Actions
- Actions
- Actions
- Actions
- Actions
- Actions
- Actions
- Actions
- Actions
- Actions
- Actions
- Actions
- Actions
- Actions
- Actions
- Actions
- Actions
- Actions
- Actions
- Actions
- Actions
- Actions
- Actions
- Actions
- Actions
- Actions
- Actions
- Actions
- Actions
- Actions
- Actions
- Actions
- Actions
- Actions
- Actions
- Actions
- Actions
- Actions
- Actions
- Actions
- Actions
- Actions
- Actions
- Actions
- Actions
- Actions
- Actions
- Actions
- Actions
- Actions
- Actions
- Actions
- Actions
- Actions
- Actions
- Actions
- Actions
- Actions
- Actions
- Actions
- Actions
- Actions
- Actions
- Actions
- Actions
- Actions
- Actions
- Actions
- Actions
- Actions
- Actions
- Actions
- Actions
- Actions
- Actions
- Actions
- Actions
- Actions
- Actions
- Actions
- Actions
- Actions
- Actions
- Actions
- Actions
- Actions
- Actions
- Actions
- Actions
- Actions
- Actions
- Actions
- Actions
- Actions
- Actions
- Actions
- Actions
- Actions
- Actions
- Actions
- Actions
- Actions
- Actions
- Actions
- Actions
- Actions
- Actions
- Actions
- Actions
- Actions
- Actions
- Actions
- Actions
- Actions
- Actions
- Actions
- Actions
- Actions
- Actions
- Actions
- Actions
- Actions
- Actions
- Actions
- Actions
- Actions
- Actions
- Actions
- Actions
- Actions
- Actions
- Actions
- Actions
- Actions
- Actions
- Actions
- Actions
- Actions
- Actions
- Actions
- Actions
- Actions
- Actions
- Actions
- Actions
- Actions
- Actions
- Actions
- Actions
- Actions
- Actions
- Actions
- Actions
- Actions
- Actions
- Actions
- Actions
- Actions
- Actions
- Actions
- Actions
- Actions
- Actions
- Actions
- Actions
- Actions
- Actions
- Actions
- Actions
- Actions
- Actions
- Actions
- Actions
- Actions
- Actions
- Actions
- Actions
- Actions
- Actions
- Actions
- Actions
- Actions
- Actions
- Actions
- Actions
- Actions
- Actions
- Actions
- Actions
- Actions
- Actions
- Actions
- Actions
- Actions
- Actions
- Actions
- Actions
- Actions
- Actions
- Actions
- Actions
- Actions
- Actions
- Actions
- Actions
- Actions
- Actions
- Actions
- Actions
- Actions
- Actions
- Actions
- Actions
- Actions
- Actions
- Actions
- Actions
- Actions
- Actions
- Actions
- Actions
- Actions
- Actions
- Actions
- Actions
- Actions
- Actions
- Actions
- Actions
- Actions
- Actions
- Actions
- Actions
- Actions
- Actions
- Actions
- Actions
- Actions
- Actions
- Actions
- Actions
- Actions
- Actions
- Actions
- Actions
- Actions
- Actions
- Actions
- Actions
- Actions
- Actions
- Actions
- Actions
- Actions
- Actions
- Actions
- Actions
- Actions
- Actions
- Actions
- Actions
- Actions
- Actions
- Actions
- Actions
- Actions
- Actions
- Actions
- Actions
- Actions
- Actions
- Actions
- Actions
- Actions
- Actions
- Actions
LinkOut - more resources
Full Text Sources
Medical
Molecular Biology Databases
Research Materials
Miscellaneous
