. 2008 Nov;29(6):1054-61.
doi: 10.1016/j.neuro.2008.08.003. Epub 2008 Aug 19.

Prevention of methylmercury-induced mitochondrial depolarization, glutathione depletion and cell death by 15-deoxy-delta-12,14-prostaglandin J(2)

Affiliations

Prevention of methylmercury-induced mitochondrial depolarization, glutathione depletion and cell death by 15-deoxy-delta-12,14-prostaglandin J(2)

Jason Y Chang et al. Neurotoxicology. 2008 Nov.

Abstract

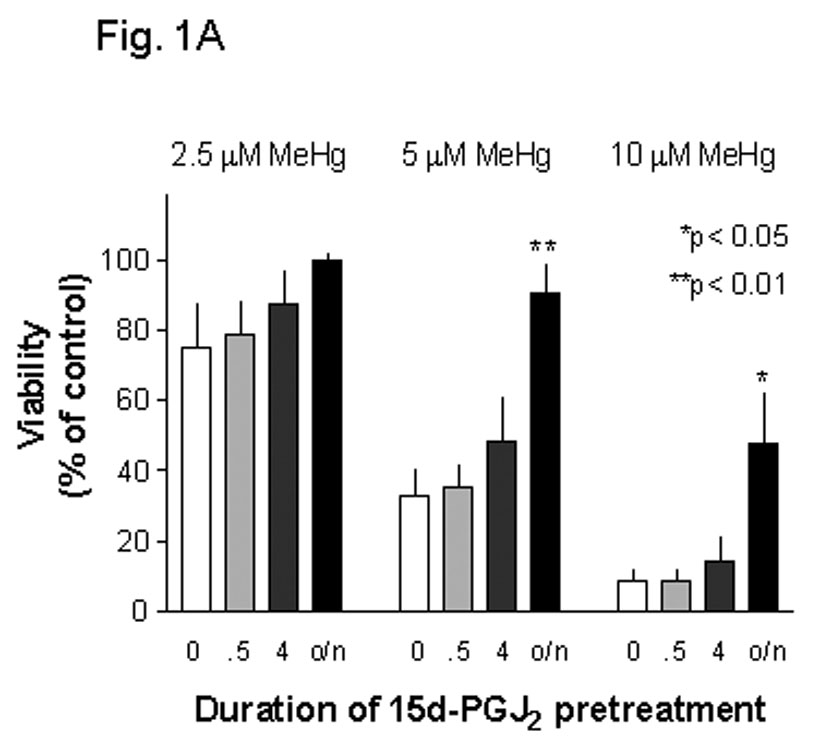
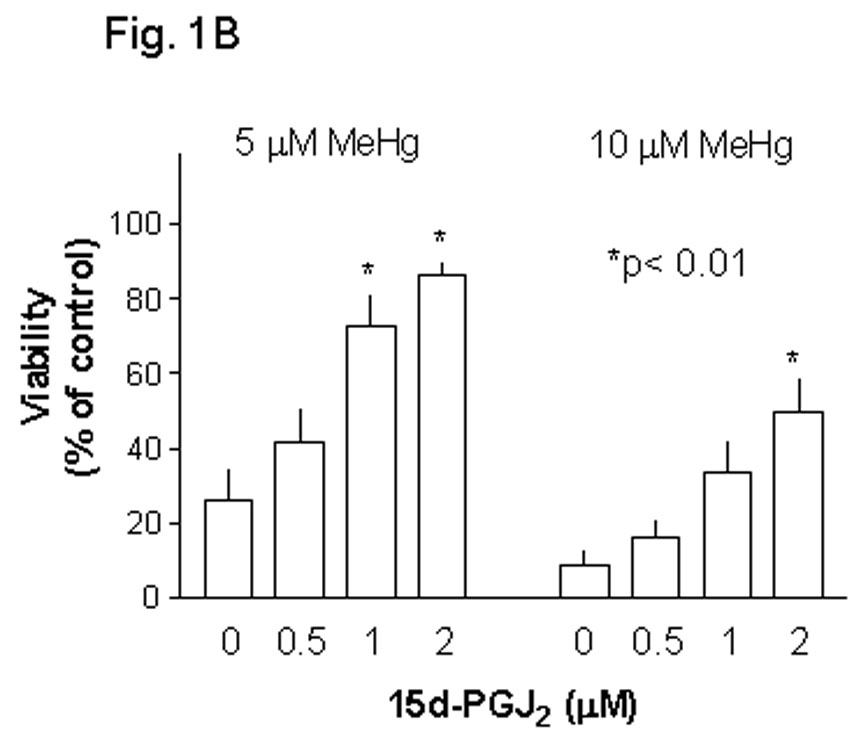
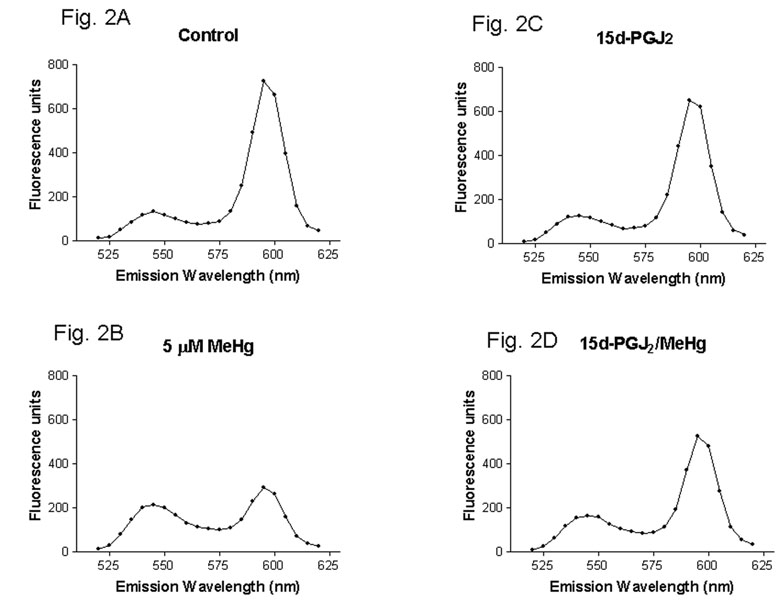
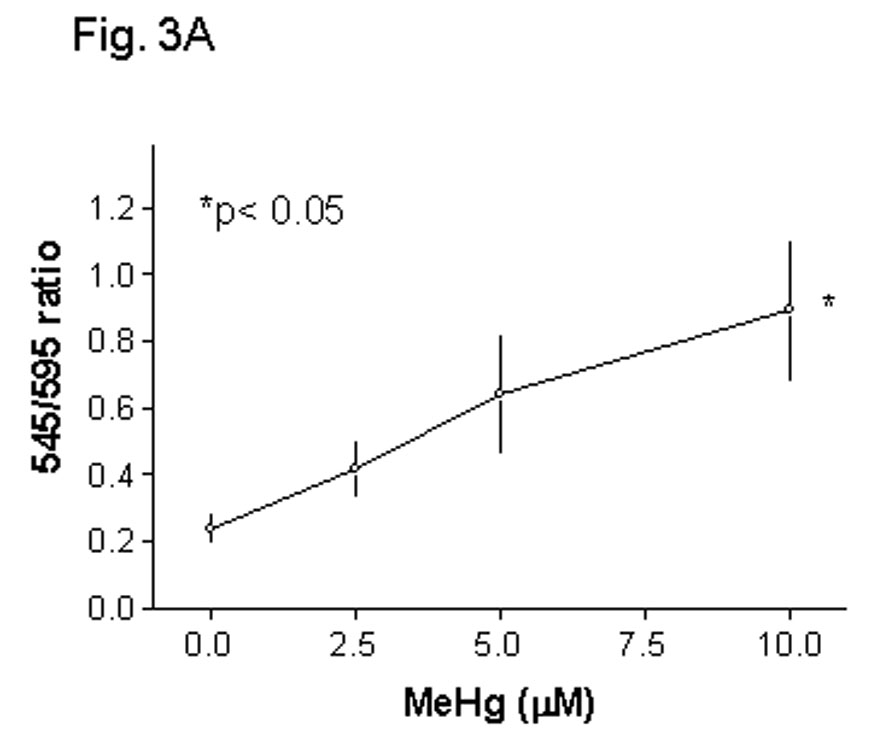
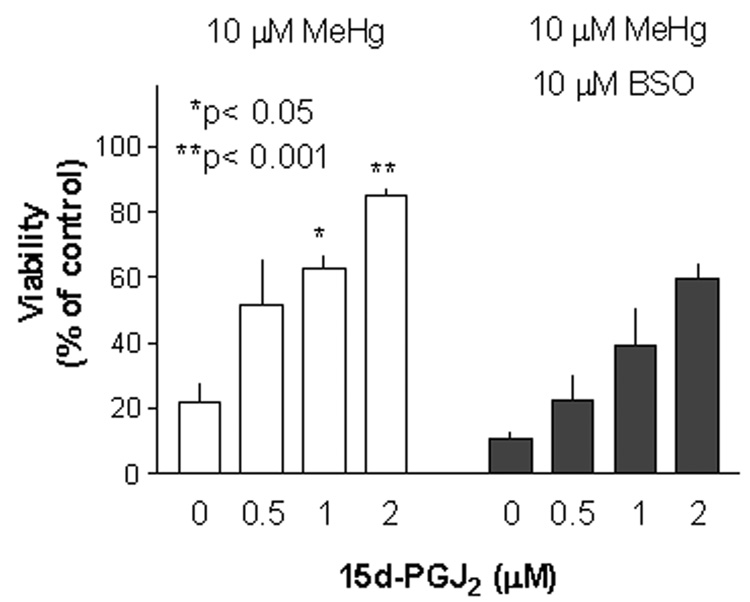
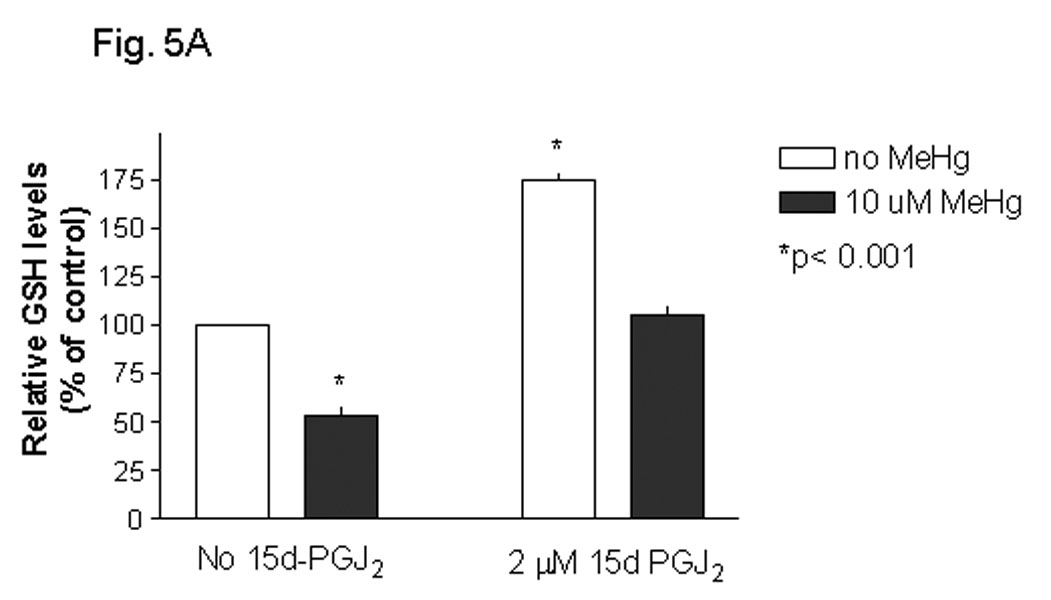
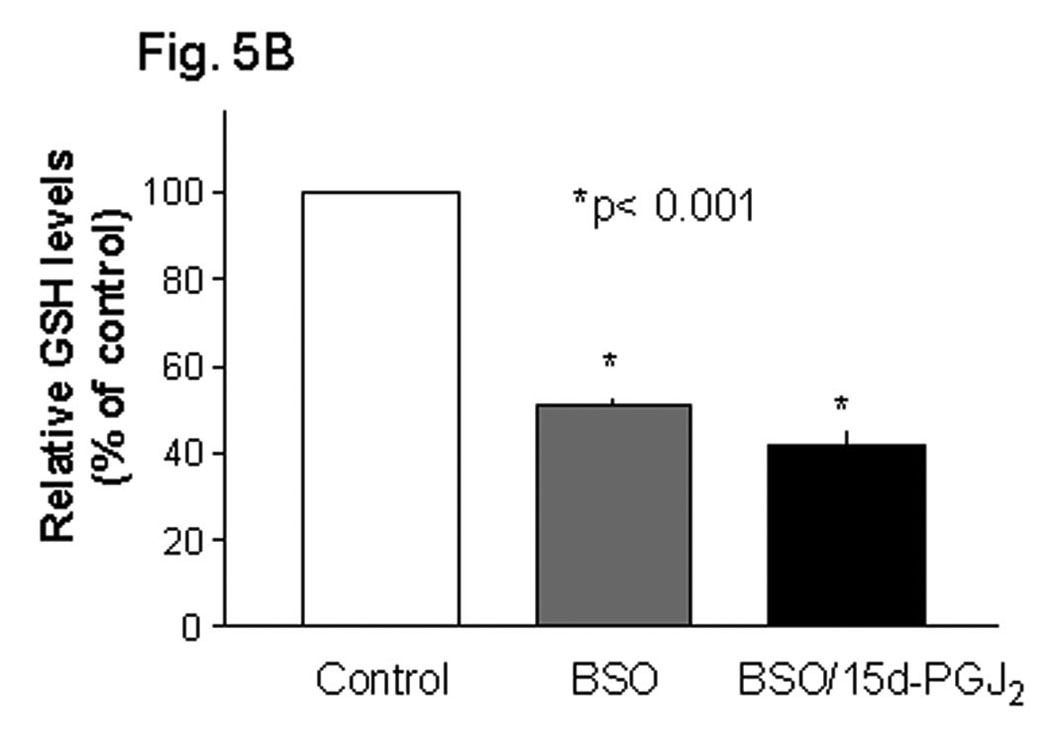
Methylmercury (MeHg) is an environmental toxin that causes severe neurological complications in humans and experimental animals. In addition to neurons, glia in the central nervous system are very susceptible to MeHg toxicity. Pretreatment of glia with the prostaglandin derivative, 15-deoxy-delta-12,14-prostaglandin J(2) (15d-PGJ(2)), caused a significant protection against MeHg cytotoxicity. Results with the C6 glioma cells demonstrated that the protection was dependent on the duration of pretreatment, suggesting that time was required for the up-regulation of cellular defenses. Subsequent experiments indicated that 15d-PGJ(2) prevented MeHg induced mitochondrial depolarization. Similar protection against MeHg cytotoxicity was observed in primary cultures of mouse glia. Analysis of cellular glutathione (GSH) levels indicated that 15d-PGJ(2) caused an up-regulation of GSH and prevented MeHg-induced GSH depletion. Buthionine sulfoximine (BSO), a GSH synthesis inhibitor, completely inhibited the GSH induction by 15d-PGJ(2). However, BSO did not prevent the stabilization of mitochondrial potential and only partially prevented the protection caused by 15d-PGJ(2). While induction of heme oxygenase-1 was implicated in the cytoprotection by 15d-PGJ(2) under some experimental conditions, additional experiments indicated that this enzyme was not involved in the cytoprotection observed in this system. Together, these results suggested that while up-regulation of GSH by 15d-PGJ(2) might help cells to defend against MeHg toxicity, there may be other yet unidentified mechanism(s) initiated by 15d-PGJ(2) treatment that contributed to its protection against MeHg cytotoxicity.


Figures

Fig. 1
Fig. 1. Prevention of MeHg cytotoxicity by 15d-PGJ2
Fig. 1A: C6 glioma cells were pretreated with nothing (1st column of each set), 1 µM 15d-PGJ2 for 0.5 hrs (2nd column of each set), 4 hrs (3rd column of each set) or overnight (>18 hrs, 4th column of each set), followed by various concentrations of MeHg (without 15d-PGJ2) overnight, and then the viability of each treatment was determined. Viabilities were compared by two-way ANOVA with MeHg concentrations and pretreatment duration as between group factors. The analysis revealed significant main effects of MeHg concentrations and pretreatment duration on the viability. There was no interaction between these two factors. These results indicated that MeHg caused concentration-dependent decrease in cell viability. At each MeHg concentration used, longer pretreatment with 15d-PGJ2 led to a better protection against MeHg cytotoxicity. Three sets of one-way ANOVA and the Bonferroni post-hoc analyses were performed to determine within group differences at each MeHg concentration. Compared to controls in each set, the analysis indicated significant protection was achieved by overnight 15d-PGJ2 pretreatment. Fig. 1B C6 glioma cells were treated with 0.5, 1 or 2 µM 15d-PGJ2 2 hrs after plating. After overnight incubation, the cultures were treated with 5 µM (left-side columns) or 10 µM (right-side columns) MeHg for 1 day (without 15d-PGJ2) before the viability of each treatment was determined. Viabilities were compared by two-way ANOVA with MeHg concentrations and 15d-PGJ2 concentrations as between group factors. This analysis revealed significant main effects of MeHg concentrations and 15d-PGJ2 concentrations on the viability. There was no interaction between these two factors. These results indicated that MeHg caused concentration dependent decrease in cell viability. At each MeHg concentration used, 15d-PGJ2 pretreatment of cells caused a concentration-dependent protection against MeHg cytotoxicity. Two sets of one-way ANOVA and the Bonferroni post-hoc analyses were performed to determine within group differences at each MeHg concentration. Compared to appropriate controls, results indicated that 15d-PGJ2 at 1 µM or above caused significant protection in 5 µM MeHg treated cultures, and this agent at 2 µM caused significant protection in 10 µM MeHg treated cultures.
Fig. 2
Fig. 2. MeHg caused mitochondrial depolarization
C6 glioma cells were treated with (A) nothing or (B) 5 µM MeHg for 4 hrs or (C) 1 µM 15d-PGJ2 overnight or (D) 1 µM 15d-PGJ2 overnight followed by 5 µM MeHg for 4 hrs, and then the alteration of mitochondrial membrane potential (ΔΨm) was determined by the JC-1 staining. Results indicated that MeHg caused an increase in the JC-1 monomers (545 nm peak) and a decrease in the JC-1 aggregates (595 nm peak), a sign of mitochondrial depolarization (compare Fig. 2A with Fig. 2B). While 15d-PGJ2 itself had no effect on the spectrum (Fig. 2C), it prevented the spectrum shift caused by MeHg (Fig. 2D).
Fig. 3
Fig. 3. Quantification of relative mitochondrial depolarization caused by MeHg
(A) Concentration-response: C6 glioma cells were treated with various concentrations of MeHg for 4 hrs followed by the JC-1 dye, and then the emission intensity ratio between the 545 nm and the 595 nm peaks was used as an indication of mitochondrial membrane potential. Results were analyzed by one-way ANOVA and the Bonferroni post-hoc analysis. Compared to control levels, MeHg at 10 µM caused a significant increase in the 545/595 emission intensity ratio, indicating an increase of mitochondrial depolarization. (B) Time-response: Concurrent experiments determined the time-dependent mitochondrial depolarization caused by 5 µM and whether this could be affected by 1 µM 15d-PGJ2 pretreatment. Results were compared by two-way ANOVA with the duration of MeHg treatment and the presence of 15d-PGJ2 as between group factors. This analysis revealed a marginal effect of MeHg treatment duration on the 545/595 emission intensity ratio (p= 0.07). However, there was a significant main effect of 15d-PGJ2 in reducing the 545/595 emission intensity ratio. There was no interaction between these two factors. Open columns: MeHg alone for 1, 2 or 4 hours. Solid columns: MeHg plus 1 µM 15d-PGJ2.
Fig. 4
Fig. 4. Protection against MeHg cytotoxicity by 15d-PGJ2: Attenuation by BSO
Primary mouse glia were treated with various concentrations of 15d-PGJ2 (left-side columns) or 15d-PGJ2 plus 10 µM BSO (right-side columns) overnight followed by 10 µM MeHg (without 15d-PGJ2 or BSO) for a day, and then the viability of each treatment was determined. One-way ANOVA and the Bonferroni post-hoc analysis was performed with the data presented in the left-side columns. Compared to cells without 15d-PGJ2 pretreatment (1st column), 15d-PGJ2 at 1 µM or above caused significant protection against MeHg cytotoxicity. In a separate set of analysis, two-way ANOVA was used to compare the left-side and right-side columns with 15d-PGJ2 concentrations and the presence of BSO as between group factors. This was followed by the Bonferroni post-hoc analysis to determine within group differences at each 15d-PGJ2 concentration. Results revealed significant main effects of 15d-PGJ2 concentrations and the presence of BSO on the viability. There was no interaction between these two factors. While 15d- PGJ2 caused a concentration-dependent protection of mouse glia against MeHg cytotoxicity (left-side columns), the protection was attenuated if BSO was present (right-side columns). The degree of attenuation was significant at 0.5 µM 15d-PGJ2 but not at higher concentrations (1 µM or 2 µM) of 15d-PGJ2.
Fig. 5
Fig. 5. Determination of cellular GSH levels
(A) Prevention of MeHg-induced GSH depletion by 15d-PGJ2 pretreatment. Primary mouse glia were pretreated with nothing or with 2 µM 15d-PGJ2 overnight followed by fresh medium or 10 µM MeHg (without 15d-PGJ2) for 4 hrs, and then the cellular GSH levels were determined. Results from left to right were: control (1st column), MeHg-treated (2nd column), 15d-PGJ2 overnight treatment (3rd column), 15d-PGJ2 overnight treatment followed by MeHg (4th column). Two-way ANOVA indicated that both MeHg and 15d-PGJ2 had significant main effects on the relative GSH levels, and there was a significant interaction between these two factors. A separate set of analysis was performed to compare GSH levels in each condition. Compared to control levels, one-way ANOVA with the Bonferroni post-hoc test indicated that MeHg treatment significantly decreased the cellular GSH levels, and 15d-PGJ2 significantly increased the cellular GSH levels. However, there was no difference between controls and cells treated with 15d-PGJ2 overnight followed by MeHg. These results indicated that pretreatment of cultures with 15d-PGJ2 protected cells from MeHg-induced GSH depletion. (B) BSO inhibited 15d-PGJ2-induced GSH up-regulation. Primary mouse glia were treated with nothing (1st column), 10 µM BSO (2nd column) or 10 µM BSO plus 2 µM 15d-PGJ2 (3rd column) overnight, and then cellular levels of GSH were determined. One-way ANOVA with the Bonferroni post-hoc test indicated that, compared to controls, BSO significantly reduced cellular GSH levels. While 15d-PGJ2 could increased cellular GSH levels (Fig. 5A), this did not happen in the presence of BSO.
Fig. 6
Fig. 6. Effect of 15d-PGJ2 and BSO on MeHg-induced mitochondrial depolarization in mouse glia
Primary mouse glia were treated with nothing (control), 2 µM 15d-PGJ2, 10 µM BSO or 2 µM 15d-PGJ2 plus 10 µM BSO overnight as indicated. Cells were then treated with medium (open columns) or 10 µM MeHg (closed columns), without 15d-PGJ2 or BSO, for 4 hrs before the degree of mitochondrial depolarization in each culture was determined. Results were compared by two-way ANOVA with the presence of MeHg and testing agents as between group factors. This was followed by the Bonferroni post-hoc analysis to determine within group differences (with or without MeHg). This analysis revealed significant main effects of MeHg on the 545/595 emission intensity ratio. Without MeHg, none of the testing agents significantly altered the 545/595 emission intensity ratio. There was no interaction between these two factors. While MeHg could raised the 545/595 emission intensity ratio, this property was modified in the presence of various testing agents. See text for detailed discussion of the results.

Similar articles

Cited by

References

    1. Allen JW, El-Oqayli H, Aschner M, Syversen T, Sonnewald U. Methylmercury has a selective effect on mitochondria in cultured astrocytes in the presence of [U-(13)C]glutamate. Brain Res. 2001;908:149–154. - PubMed
    1. Alvarez-Maqueda M, El Bekay R, Alba G, et al. 15-deoxy-delta 12,14-prostaglandin J2 induces heme oxygenase-1 gene expression in a reactive oxygen species-dependent manner in human lymphocytes. J Biol Chem. 2004;279:21929–21937. - PubMed
    1. Aoun P, Simpkins JW, Agarwal N. Role of PPAR-gamma ligands in neuroprotection against glutamate-induced cytotoxicity in retinal ganglion cells. Invest Ophthalmol Vis Sci. 2003;44:2999–3004. - PubMed
    1. Aschner M. Methylmercury in astrocytes--what possible significance? Neurotoxicology. 1996;17:93–106. - PubMed
    1. Aschner M, Allen JW, Kimelberg HK, LoPachin RM, Streit WJ. Glial cells in neurotoxicity development. Annu Rev Pharmacol Toxicol. 1999;39:151–173. - PubMed

Publication types

MeSH terms

LinkOut - more resources