. 2008 Sep;27(9):1230-41.
doi: 10.1109/TMI.2008.920619.

Optimal wavelet transform for the detection of microaneurysms in retina photographs

Affiliations

Optimal wavelet transform for the detection of microaneurysms in retina photographs

Gwénolé Quellec et al. IEEE Trans Med Imaging. 2008 Sep.

Abstract

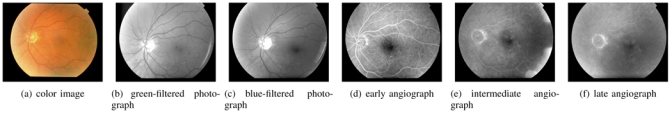
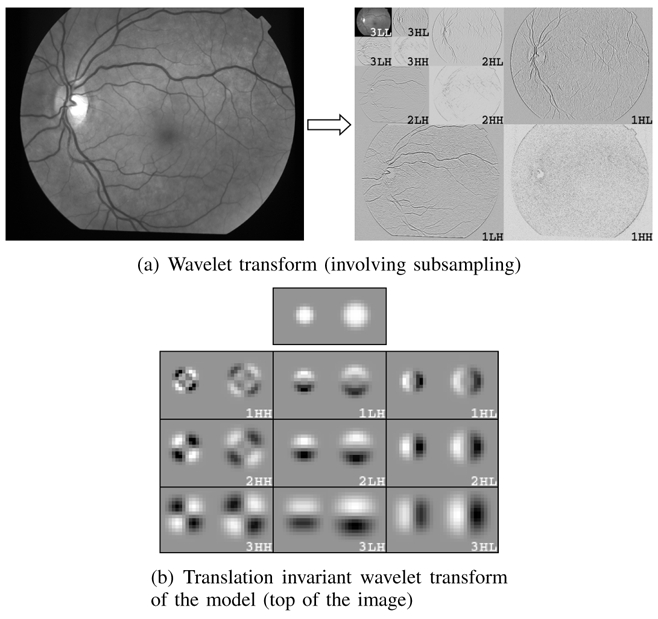
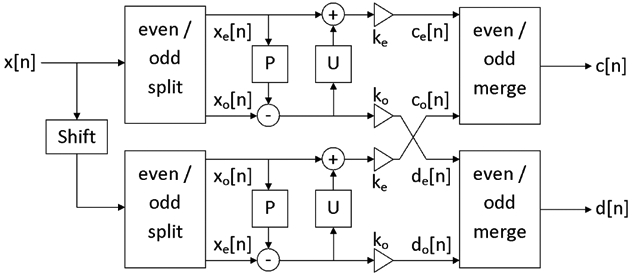
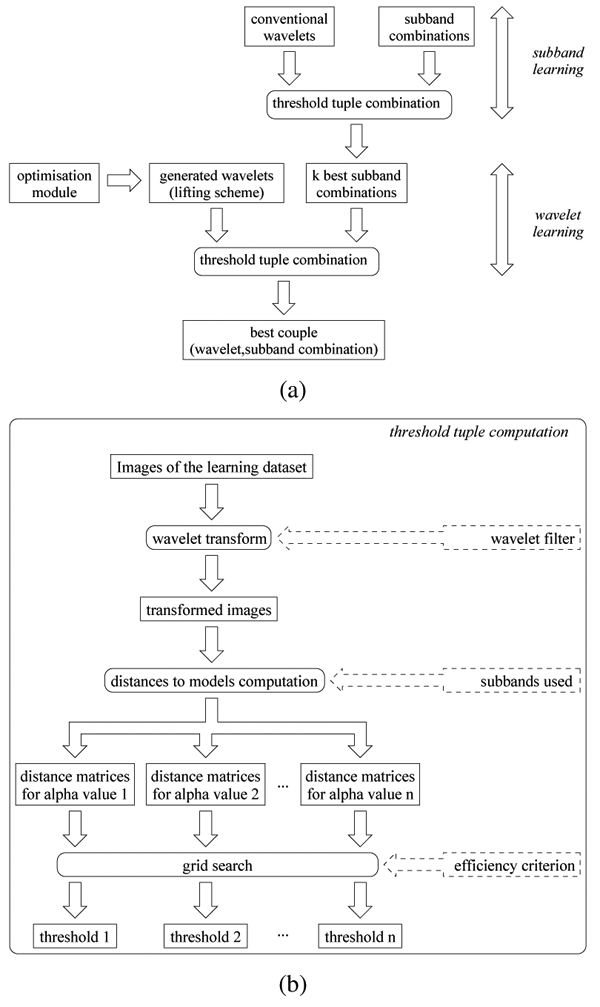
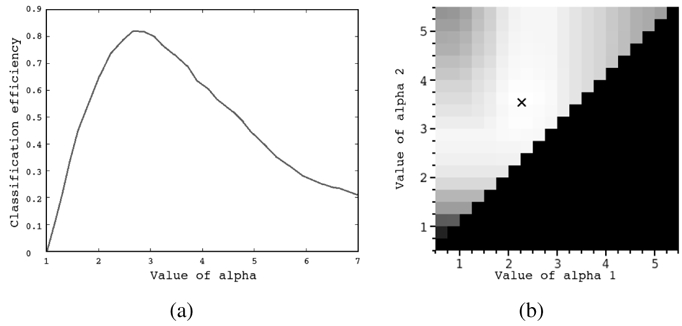
In this paper, we propose an automatic method to detect microaneurysms in retina photographs. Microaneurysms are the most frequent and usually the first lesions to appear as a consequence of diabetic retinopathy. So, their detection is necessary for both screening the pathology and follow up (progression measurement). Automating this task, which is currently performed manually, would bring more objectivity and reproducibility. We propose to detect them by locally matching a lesion template in subbands of wavelet transformed images. To improve the method performance, we have searched for the best adapted wavelet within the lifting scheme framework. The optimization process is based on a genetic algorithm followed by Powell's direction set descent. Results are evaluated on 120 retinal images analyzed by an expert and the optimal wavelet is compared to different conventional mother wavelets. These images are of three different modalities: there are color photographs, green filtered photographs, and angiographs. Depending on the imaging modality, microaneurysms were detected with a sensitivity of respectively 89.62%, 90.24%, and 93.74% and a positive predictive value of respectively 89.50%, 89.75%, and 91.67%, which is better than previously published methods.


Figures

Fig. 1
Fig. 1
Series of retina images from a patient file. Angiographs are obtained by injecting a contrast product and taking several snapshots to obtain a temporal series: (d)(e)(f).
Fig. 2
Fig. 2
1D generalized Gaussian function f (r; α, β, γ, δ)
Fig. 3
Fig. 3
Microaneurysm model validation. In figure (a), four examples of microaneurysms (on the left) and the model (on the right) are displayed together with image profiles. Figure (b) reports the mean and standard deviation of the pixel-wise estimation error, given in table II. The mean for each interval is represented by a square, and standard deviations by line segments: the length of a half segment corresponds to the standard deviation. And finally, figure (c) illustrates the distribution of flatness among microaneurysms: four ellipses with different flatnesses are displayed together with the percentage of manually delimited lesions of greater flatness.
Fig. 4
Fig. 4
Examples of microaneurysms within moving windows. The microaneurysm detector tries to match models with n = 2 different values for α; a different moving window is used for each value of α. The two windows matching each example are shown in the figure.
Fig. 5
Fig. 5
The wavelet transform. In both figures (a) and (b), there are three subbands at each scale, depending on whether the rows/columns were high-passed or low-passed filtered. In these examples, the number of decomposition levels is 3 (Nl = 3). In the wavelet transform images, positive values are represented in white, negative values in black. In image (b), two microaneurysm models with different values for α are decomposed.
Fig. 6
Fig. 6
Two-channel filterbank for the translation invariant wavelet transform within the lifting scheme framework. ke and ko normalize the energy of the underlying scaling and wavelet coefficients.
Fig. 7
Fig. 7
Overall learning procedure
Fig. 8
Fig. 8
Influence of the generalized Gaussian function standard deviation on the classification score. Figure (a) shows the classification score according to the standard deviation α in the case n = 1 (when template matching is performed with a single model size). Figure (b) shows the classification score according to the couple of standard deviations (α12), α1 < α2, in the case n = 2. Classification scores are proportional to the gray level and the optimal couple is represented by a cross.
Fig. 9
Fig. 9
Best combinations of subbands for template matching using conventional wavelets. The first 8 best combinations in decreasing order of their scores (from (a) to (h)). It emerges that the highest frequency subbands (1HH, 1HL, 1LH) and the lowest (3LL), as well as the diagonal subbands (1HH, 2HH, 3HH) are not used (see figure 5 for the subband names).
Fig. 10
Fig. 10
Example of green filtered photograph: (a) original image, (b) analysed image, (c) processed image. There is a false positive detection (right border).
Fig. 11
Fig. 11
Examples of good quality (a) and blurred image (e): the algorithm works well on both examples with the same set of parameters. Two areas containing microaneurysms from different images are displayed with their optimal wavelet transform (the subbands used by the WTM only). These images are angiographs. As a consequence microaneurysms are white. Images have been enhanced, so some microaneurysms seem to have homogeneous values. They were processed with the same set of parameters. Each row corresponds to an image. (a),(e): raw images, (b),(f): automatic detection (which matches the manual detection), (c),(g): vertical decomposition subband considered, (d),(h): horizontal decomposition subband considered.

References

    1. Klein R, Klein BEK, Moss SE. Visual impairment in diabetes. Ophthalmology. 1984;91:1–9. - PubMed
    1. Sjolie AK, Stephenson J, Aldington S, Kohner E, Janka H, Stevens L, Fuller J the EURODIAB Complications Study Group. Retinopathy and vision loss in insulin-dependent diabetes in Europe. Ophthalmology. 1997;104:252–260. - PubMed
    1. Javitt JC. Cost savings associated with detection and treatment of diabetic eye disease. Pharmacoeconomics. 1995;8:33–9. - PubMed
    1. Teng T, Lefley M, Claremont D. Progress towards automated diabetic ocular screening: a review of image analysis and intelligent systems for diabetic retinopathy. Med Biol Eng Comput. 2002 Jan;40(1):2–13. - PubMed
    1. Mendonca AM, Campilho AJ, Nunes JM. Automatic segmentation of microaneurysms in retinal angiograms of diabetic patient. Proceedings. International Conference on Image Analysis and Processing; September 1999.

Publication types

MeSH terms