

Maximal STAT5-induced proliferation and self-renewal at intermediate STAT5 activity levels
- PMID: 18779318
- PMCID: PMC2573230
- DOI: 10.1128/MCB.01025-08
Maximal STAT5-induced proliferation and self-renewal at intermediate STAT5 activity levels
Abstract
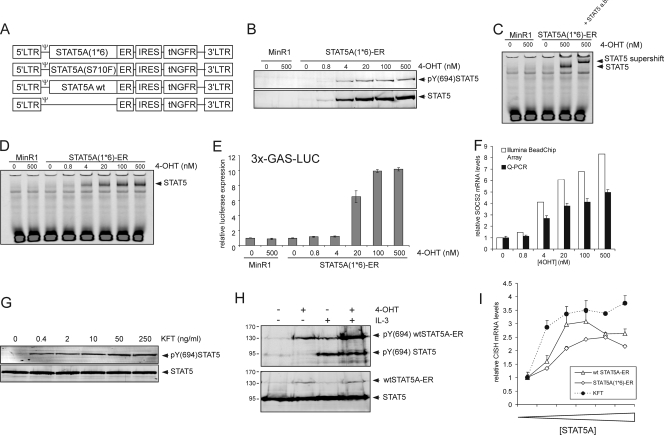
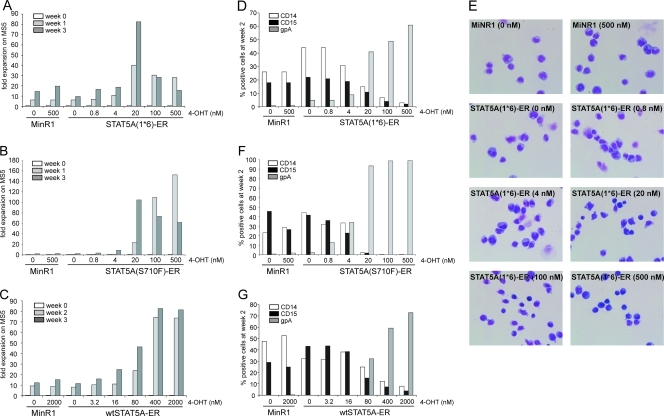
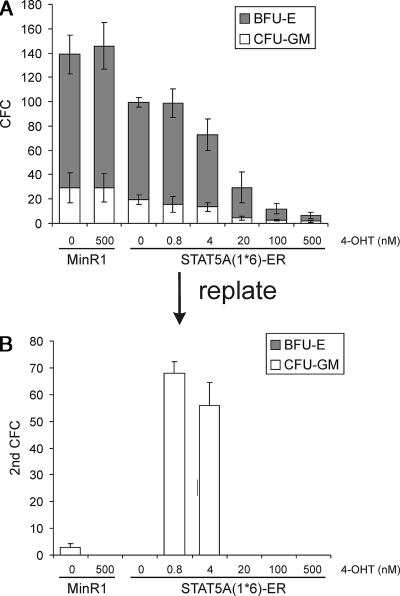
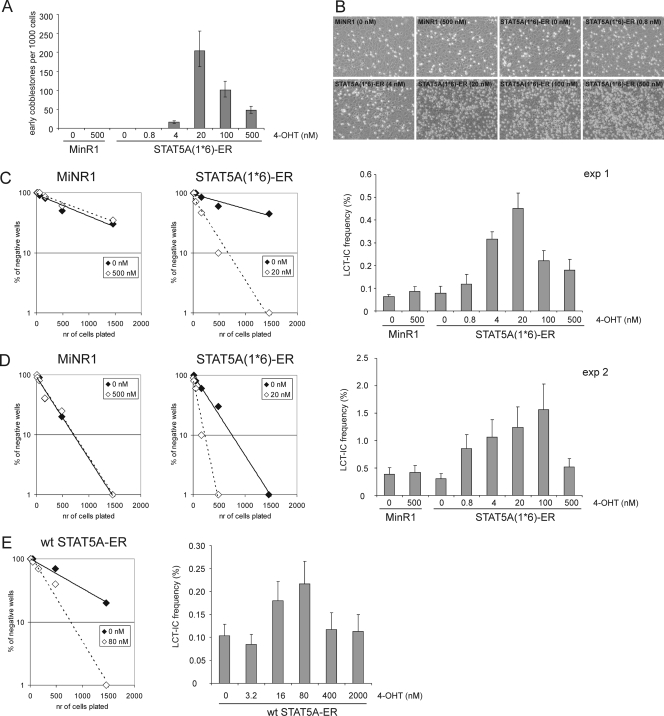
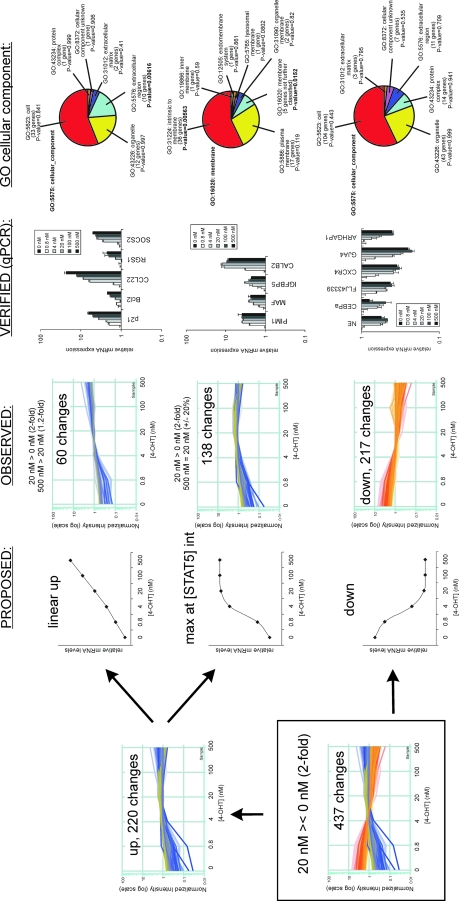
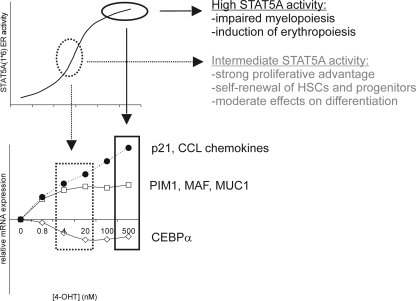
The level of transcription factor activity critically regulates cell fate decisions, such as hematopoietic stem cell (HSC) self-renewal and differentiation. We introduced STAT5A transcriptional activity into human HSCs/progenitor cells in a dose-dependent manner by overexpression of a tamoxifen-inducible STAT5A(1*6)-estrogen receptor fusion protein. Induction of STAT5A activity in CD34(+) cells resulted in impaired myelopoiesis and induction of erythropoiesis, which was most pronounced at the highest STAT5A transactivation levels. In contrast, intermediate STAT5A activity levels resulted in the most pronounced proliferative advantage of CD34(+) cells. This coincided with increased cobblestone area-forming cell and long-term-culture-initiating cell frequencies, which were predominantly elevated at intermediate STAT5A activity levels but not at high STAT5A levels. Self-renewal of progenitors was addressed by serial replating of CFU, and only progenitors containing intermediate STAT5A activity levels contained self-renewal capacity. By extensive gene expression profiling we could identify gene expression patterns of STAT5 target genes that predominantly associated with a self-renewal and long-term expansion phenotype versus those that identified a predominant differentiation phenotype.
Figures
Similar articles
-
STAT5-induced self-renewal and impaired myelopoiesis of human hematopoietic stem/progenitor cells involves down-modulation of C/EBPalpha.Blood. 2006 Jun 1;107(11):4326-33. doi: 10.1182/blood-2005-11-4608. Epub 2006 Feb 2. Blood. 2006. PMID: 16455947
-
Constitutive activation of Flt3 and STAT5A enhances self-renewal and alters differentiation of hematopoietic stem cells.Exp Hematol. 2007 Apr;35(4 Suppl 1):105-16. doi: 10.1016/j.exphem.2007.01.018. Exp Hematol. 2007. PMID: 17379095
-
Differential contributions of STAT5A and STAT5B to stress protection and tyrosine kinase inhibitor resistance of chronic myeloid leukemia stem/progenitor cells.Cancer Res. 2013 Apr 1;73(7):2052-8. doi: 10.1158/0008-5472.CAN-12-3955. Epub 2013 Feb 11. Cancer Res. 2013. PMID: 23400594
-
Stat5a and Stat5b: fraternal twins of signal transduction and transcriptional activation.Cytokine Growth Factor Rev. 1999 Jun;10(2):131-57. doi: 10.1016/s1359-6101(99)00011-8. Cytokine Growth Factor Rev. 1999. PMID: 10743504 Review.
-
Signal transducer and activator of transcription 5a/b: biomarker and therapeutic target in prostate and breast cancer.Int J Biochem Cell Biol. 2011 Oct;43(10):1417-21. doi: 10.1016/j.biocel.2011.06.007. Epub 2011 Jun 17. Int J Biochem Cell Biol. 2011. PMID: 21704724 Free PMC article. Review.
Cited by
-
Context-Specific Growth Hormone Signaling through the Transcription Factor STAT5: Implications for the Etiology of Hepatosteatosis and Hepatocellular Carcinoma.Genes Cancer. 2011 Jan;2(1):3-9. doi: 10.1177/1947601911405046. Genes Cancer. 2011. PMID: 21779476 Free PMC article.
-
JAK-STAT in Early Hematopoiesis and Leukemia.Front Cell Dev Biol. 2021 May 14;9:669363. doi: 10.3389/fcell.2021.669363. eCollection 2021. Front Cell Dev Biol. 2021. PMID: 34055801 Free PMC article. Review.
-
STAT activation status differentiates leukemogenic from non-leukemogenic stem cells in AML and is suppressed by arsenic in t(6;9)-positive AML.Genes Cancer. 2014 Nov;5(11-12):378-92. doi: 10.18632/genesandcancer.39. Genes Cancer. 2014. PMID: 25568664 Free PMC article.
-
Activated STAT5 confers resistance to intestinal injury by increasing intestinal stem cell proliferation and regeneration.Stem Cell Reports. 2015 Feb 10;4(2):209-25. doi: 10.1016/j.stemcr.2014.12.004. Epub 2015 Jan 8. Stem Cell Reports. 2015. PMID: 25579133 Free PMC article.
-
Convergence of hypoxia and TGFβ pathways on cell cycle regulation in human hematopoietic stem/progenitor cells.PLoS One. 2014 Mar 31;9(3):e93494. doi: 10.1371/journal.pone.0093494. eCollection 2014. PLoS One. 2014. PMID: 24686421 Free PMC article.
References
-
- Argiropoulos, B., and R. K. Humphries. 2007. Hox genes in hematopoiesis and leukemogenesis. Oncogene 266766-6776. - PubMed
-
- Barjesteh van Waalwijk van Doorn-Khosrovani, S., C. Erpelink, J. Meijer, S. van Oosterhoud, W. L. van Putten, P. J. Valk, H. Berna Beverloo, D. G. Tenen, B. Lowenberg, and R. Delwel. 2003. Biallelic mutations in the CEBPA gene and low CEBPA expression levels as prognostic markers in intermediate-risk AML. Hematol. J. 431-40. - PubMed
-
- Birkenkamp, K. U., M. Geugien, H. H. Lemmink, W. Kruijer, and E. Vellenga. 2001. Regulation of constitutive STAT5 phosphorylation in acute myeloid leukemia blasts. Leukemia 151923-1931. - PubMed
-
- Bradley, H. L., C. Couldrey, and K. D. Bunting. 2004. Hematopoietic-repopulating defects from STAT5-deficient bone marrow are not fully accounted for by loss of thrombopoietin responsiveness. Blood 1032965-2972. - PubMed
Publication types
MeSH terms
Substances
LinkOut - more resources
Full Text Sources
Medical
Miscellaneous