. 2008 Sep 29;205(10):2319-37.
doi: 10.1084/jem.20080421. Epub 2008 Sep 8.

Ly6c+ "inflammatory monocytes" are microglial precursors recruited in a pathogenic manner in West Nile virus encephalitis

Affiliations

Ly6c+ "inflammatory monocytes" are microglial precursors recruited in a pathogenic manner in West Nile virus encephalitis

Daniel R Getts et al. J Exp Med. .

Abstract

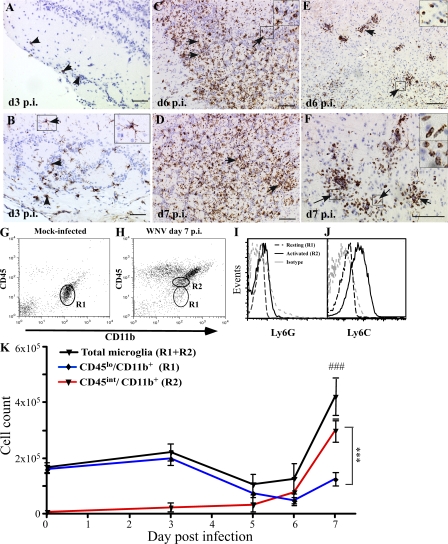
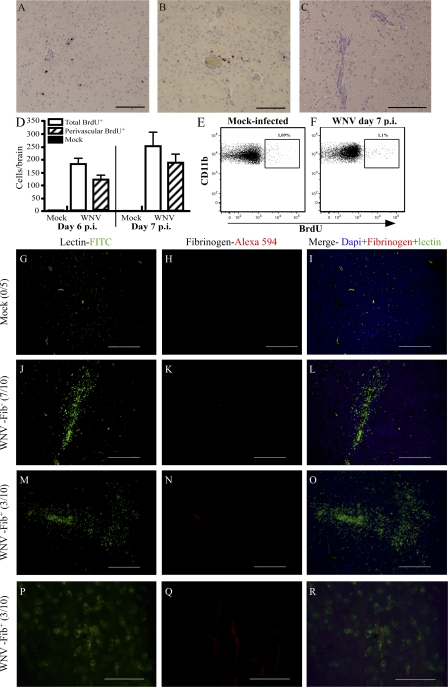
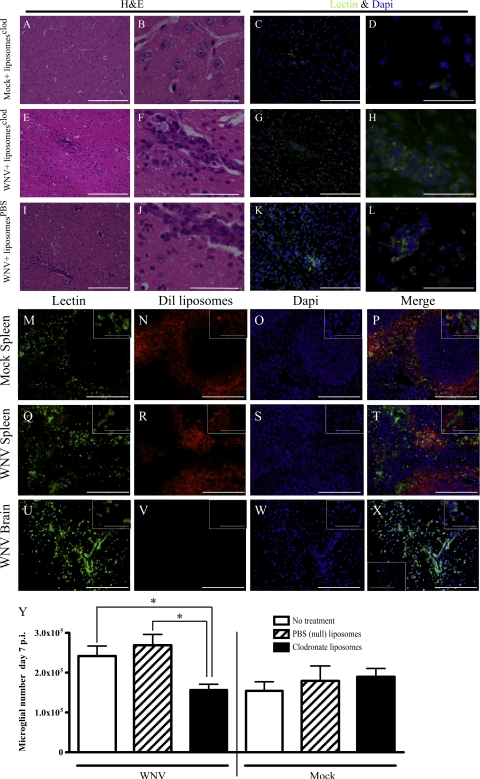
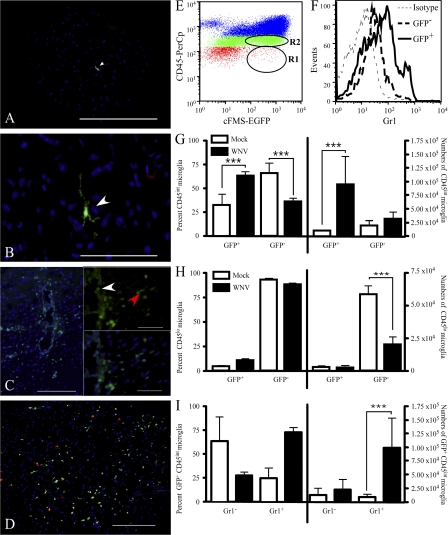
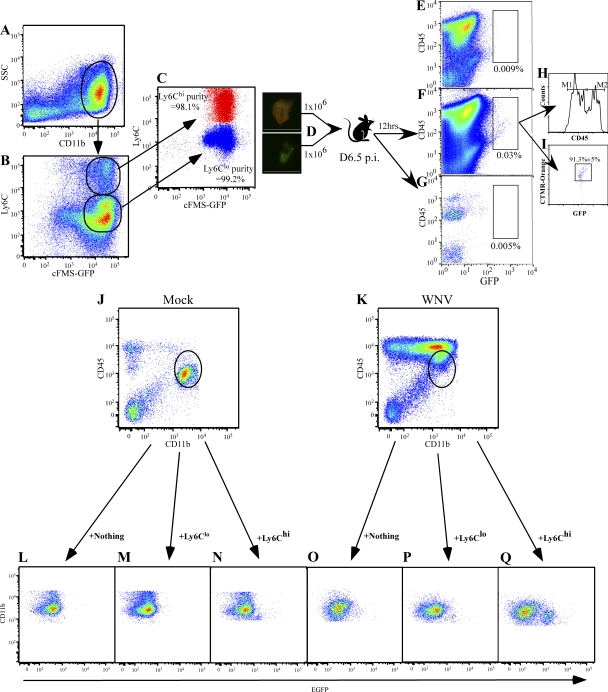
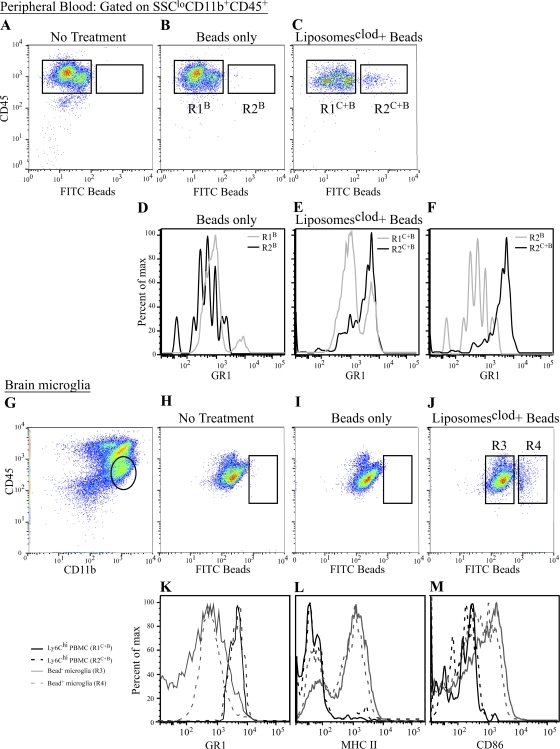
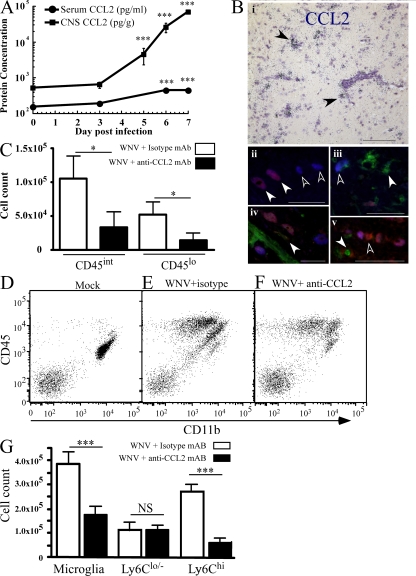
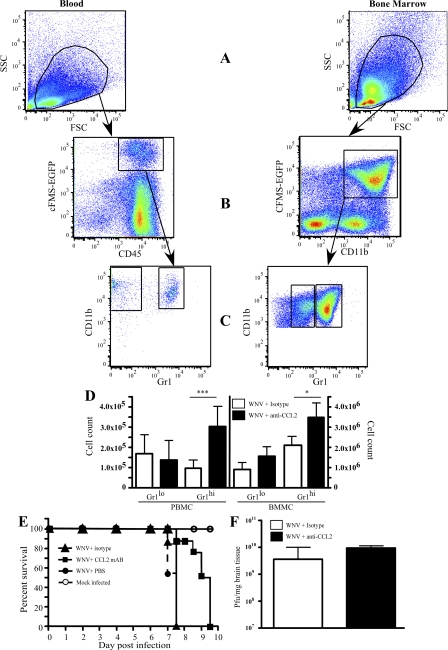
In a lethal West Nile virus (WNV) model, central nervous system infection triggered a threefold increase in CD45(int)/CD11b(+)/CD11c(-) microglia at days 6-7 postinfection (p.i.). Few microglia were proliferating, suggesting that the increased numbers were derived from a migratory precursor cell. Depletion of "circulating" (Gr1(-)(Ly6C(lo))CX3CR1(+)) and "inflammatory" (Gr1(hi)/Ly6C(hi)/CCR2(+)) classical monocytes during infection abrogated the increase in microglia. C57BL/6 chimeras reconstituted with cFMS-enhanced green fluorescent protein (EGFP) bone marrow (BM) showed large numbers of peripherally derived (GFP(+)) microglia expressing GR1(+)(Ly6C(+)) at day 7 p.i., suggesting that the inflammatory monocyte is a microglial precursor. This was confirmed by adoptive transfer of labeled BM (Ly6C(hi)/CD115(+)) or circulating inflammatory monocytes that trafficked to the WNV-infected brain and expressed a microglial phenotype. CCL2 is a chemokine that is highly expressed during WNV infection and important in inflammatory monocyte trafficking. Neutralization of CCL2 not only reduced the number of GFP(+) microglia in the brain during WNV infection but prolonged the life of infected animals. Therefore, CCL2-dependent inflammatory monocyte migration is critical for increases in microglia during WNV infection and may also play a pathogenic role during WNV encephalitis.


Figures

Figure 1.
Figure 1.
Kinetics of microglial change during WNV infection. WNV NS-1 protein first appeared in the outermost layer of the olfactory bulb on day 3 p.i. (A, arrowheads). Early activated microglia, identified by lectin staining and dendritic morphology, were concurrently detected in the outermost layer on day 3 p.i. (B, arrowheads and enlarged inset of the arrowed box) but nowhere else in the brain. On days 6 and 7 p.i. (C and D), scattered activated microglia (arrows and enlarged inset of the arrowed box) exhibited both amoeboid and intermediate activated morphology in the olfactory bulb. In the brain parenchyma, lectin-positive cells with amoeboid morphology (arrows and enlarged insets of arrowed boxes) were observed surrounding the blood vessels on days 6 (E) and 7 (F) p.i. Bars, 100 μM. Flow cytometry of leukocytes isolated from the whole brain in mock infected (G) showed a predominant population of resting microglia with a classical CD45lo phenotype (R1). By day 7 p.i., significant numbers of activated microglia could be identified by their CD45int expression, as indicated by R2 (H). Analysis of the total microglial population for Ly6G (I) and Ly6C (J) expression showed increased Ly6C expression on activated microglia but no Ly6G expression on resting or activated microglia. Enumeration of total microglia at days 0, 3, 5, 6, and 7 p.i. showed a major increase between days 6 and 7 p.i. (K). Increased numbers of CD45int (activated) microglia could be detected as early as day 3 p.i. (K), with numbers increasing dramatically between days 5 and 7. These changes were temporally independent of decreases in CD45lo (resting) microglial numbers, which declined from day 3 p.i. onwards. Data shown are means ± SD and are representative of three experiments with at least three mice per group. ***, P < 0.001, comparing day-7 p.i. CD45lo with day-7 p.i. CD45int; ###, P < 0.001, comparing day-7 p.i. total microglia with days 0, 5, or 6 p.i. using one-way analysis of variance (ANOVA) with a Tukey-Kramer posttest.
Figure 2.
Figure 2.
There is little cellular proliferation and negligible BBB disruption during WNV encephalitis. Mice were treated with BrdU for 3 h before sacrifice. Routine IHC for BrdU showed that BrdU+ cells localized predominantly to the perivascular cuff on days 6 (A) and 7 (B) p.i. This was not seen in mock-infected mice or mock BrdU-treated WNV-infected mice (C). Enumeration of BrdU+ cells on histological sections showed that >70% of all BrdU+ cells were perivascularly localized (D). The percentage of proliferating microglia was also determined by flow cytometry (E and F). Approximately 1% of microglia in WNV-infected and mock-infected mice were seen to be BrdU+ (E and F). To test the status of the BBB, fibrinogen IHC was performed on 10 WNV-infected mice and 5 mock-infected mice. Fibrinogen was not detected in any mock-infected mice at day 7 p.i. (0/5; G–I). Furthermore, 7/10 WNV-infected mice also failed to exhibit any evidence of fibrinogen leakage (J–L). In the three mice where fibrinogen labeling was detected, staining was scant and limited to the luminal surface of vessels (M–O, 20×; P–R, 100× images of M–O). Data shown are means ± SD. Data from BrdU experiments are representative of two experiments with at least five mice per group. Bars: (A–C) 100 μM; (G–O) 200 μM; (P–R) 50 μM.
Figure 3.
Figure 3.
C-L liposomes do not enter the WNV-infected CNS. Liposomes loaded with clodronate were injected i.v. at day 7 p.i. and, 6 h later, mice were killed. Hematoxylin and eosin (H&E) staining of brain sections showed no perivascular cuffing in mock-infected animals (A and B). In contrast, distinct perivascular cuffs were observed in the WNV-infected C-L liposome–treated group (E and F) and the WNV-infected PBS liposome-treated group (I and J). To confirm that the cells within these cuffs were of myeloid lineage, we stained sections, consecutive to those stained with H&E, with lectin. Lectin staining in brain sections from mock-infected mice confirmed the absence of perivascular cuffing (C and D). In contrast, most of the cells within the perivascular cuff were lectin+ in both the WNV-infected C-L liposome–treated (G and H) and the PBS liposome-treated (K and L) groups. To further ensure that C-L liposomes used to deplete circulating monocytes did not enter the brain, we injected D-L liposomes at day 7 p.i. Dil was found in the marginal zones of mock- (M–P) and WNV (Q–T) -infected mouse spleens. However, no D-L liposomes were found in the WNV-infected brain (U–X) or the mock-infected brain (X, bottom left inset). Top right insets are higher power views of cells in representative fields. Depletion of monocytes from the blood compartment with C-L liposomes from 1 d before infection and then every other day onwards resulted in a significant reduction in the numbers of microglia in WNV-infected mice compared with WNV-infected mice treated with null liposomes or mock-treated, as detected by flow cytometry (Y). Data shown are from at least three mice per group and are representative. C-L liposome depletion data are means ± SD and are representative of three experiments with at least three mice per group. *, P < 0.05 using a two-tailed T test. Bars: (A, C, E, G, I, K, and M–X) 200 μM; (B, D, F, H, J, L, and insets) 50 μM.
Figure 4.
Figure 4.
Histology and flow cytometry of WNV-infected cFMS-EGFP chimeras. Reconstitution of γ-irradiated C57BL/6 congenic B6.SJL-PtprcaPep3b/BoyJ (CD45.1) mice with cFMS-EGFP BM resulted in chimeras in which a small number of GFP+ cells were present in the CNS of mock-infected mice. Histologically, GFP+ cells (white arrowheads) were usually seen around the perivascular space (A); however, a small number of ramified microglia expressing GFP were seen in the parenchyma (B). During WNV infection, a large influx of GFP+ cells was seen, in most cases located to the perivascular cuff (C, 20× magnification). Insets (100× magnification of the same field) show recruited round GFP+ cells near the vessel lumen (white arrowhead) and rod-shaped GFP+ cells closer to the parenchyma (red arrowhead). Gr1 (D, red) staining of chimeras clearly showed several Gr1+/cFMS+ cells in the brain (D, yellow). Using flow cytometry (E), it was clear that a large proportion of GFP+ cells were CD45int microglia (R2) and CD45hi macrophages (blue dots), as well as Gr1+ (F). Significantly more (approximately fourfold) CD45int microglia were GFP+ at day 7 p.i., compared with mock-infected mice (G), whereas there were significantly fewer GFP CD45lo resting microglia at day 7 p.i., compared with mock-infected mice (H). Significantly more (at least fourfold) GFP+ CD45int microglia were Gr1+ at day 7 p.i., compared with mock-infected mice (I). Gr1 data shown are means ± SD and are representative of four experiments with at least three mice per group (***, P < 0.001, two tailed unpaired t test). Bars: (A and D) 200 μM; (B and C) 100 μM; (insets) 50 μM.
Figure 5.
Figure 5.
Adoptively transferred Ly6Chi monocytes traffic into the WNV-infected CNS. Ly6Chi/CD11b+/GFP+ and Ly6Clo/CD11b+/GFP+ BM cells were sorted as shown (A–C) from day 6 WNV-infected cFMS-EGFP transgenic mice. Ly6Chi monocytes were labeled as described in Materials and methods with CTMR–cell tracker orange (D). A 1:1 ratio of Ly6Chi/Ly6Clo cells was intravenously injected into WNV-infected mice on day 6.5 p.i. or into mock-infected mice, whereas some mice received no cells. Leukocytes were isolated from the brains of these WNV-infected mice receiving no cells (E) and from WNV-infected (F) and mock-infected (G) brains 12 h after transfer. GFP+ cells were only found in the CNS of WNV-infected mice (F), with the adoptively transferred cells expressing differential levels of CD45 (H) as indicated by markers M1 (CD45int) and M2 (CD45hi). More Ly6Chi (GFP+/CTMR cell tracker orange+) BM cells were found to track to the WNV-infected brain than Ly6Clo (GFP+/CTMR–cell tracker orange) BM cells (I). This was also observed when we injected these populations of cells separately into mock-infected (J and L–N) or WNV-infected mice (K and O–Q). Data are representative of two experiments with at least four mice per group. Bars, 50 μM.
Figure 6.
Figure 6.
Bead-labeled inflammatory monocytes, not GR1lo monocytes, traffic into the WNV-infected brain. As a second method for trafficking monocytes, we stably labeled peripheral Ly6Chi monocytes, as previously described (14, 51) (A–F). WNV-infected mice receiving no FITC beads had no circulating bead+ cells (A). WNV-infected mice that received only beads with no prior macrophage depletion with C-L liposomes only had beads inside Ly6Clo monocytes (R2B; B and D). In contrast, C-L liposome depletion in WNV-infected mice before bead injection resulted in the labeling of Ly6Chi inflammatory monocytes (R2C+B; C, E). The successful labeling of Ly6Chi versus Ly6Clo is confirmed by overlaying R2B and R2C+B (F). Finally, when we looked for the presence of beads in microglia (gated as shown in G) in WNV-infected mice, we found none in the non–bead-treated group (H) or the group in which Ly6Clo peripheral monocytes were labeled with beads (I). However, in WNV-infected mice where we labeled the Ly6Chi monocyte population with beads after C-L depletion, we found microglia-containing FITC beads (J). Furthermore, bead+ microglia showed down-regulated GR1, compared with bead+ inflammatory monocytes (K), suggesting down-regulation upon entry in to the CNS. Finally, these bead-labeled monocyte-derived microglia had also up-regulated their expression of MHC-II (L) and CD86 (M) upon entry into the brain.
Figure 7.
Figure 7.
CCL2 protein kinetics and neutralization during WNV infection. Using a multiplexed cytokine bead array, we measured both the serum and brain levels of CCL2. The level of CCL2 protein increased throughout infection in both brain and serum (A). CCL2 mRNA in the brain of five WNV-infected mice on day 7 p.i. was often localized to perivascular cuffs (B, i, black arrowheads). Fluorescent antibody labeling for CCL2 protein (red) and NS-1 (blue) showed that most cells expressing CCL2 were infected neurons (B, ii–iv; ii, white arrowheads). Not all infected neurons expressed CCL2 (B, ii and iii, white outlined arrowheads) and some uninfected neurons expressed CCL2. (B, v, white outlined arrowheads). The addition of lectin staining (green; B, iii–iv) showed that occasional perivascular microglia also expressed CCL2 faintly (B, iv, white arrowhead), whereas most microglia evidently did not (B, iii and v, white arrowheads). CCL2 in WNV-infected EGFP-cFMS chimeras was neutralized with intraperitoneal CCL2-neutralizing monoclonal antibody, resulting in a significant reduction in immigrant (GFP+) microglia at day 7 p.i. (C). We also determined whether this was also observed in nonirradiated mice (D–G). In nonirradiated WNV-infected mice, CCL2 neutralization (F) resulted in significantly reduced numbers of microglia, accounted for by drastic reduction in Ly6Chi-expressing cells (G), which was not observed in mock- (D) and WNV (E) -infected mice. Data shown are means ± SD and are representative of at least two experiments with at least three mice per group. CCL2 broad array data are representative of three different experiments with at least three mice per group. Statistical analysis of CCL2 protein data was conducted using one-way ANOVA with a Tukey-Kramer post test. Neutralization experiments were analyzed using a two-tailed unpaired t test comparing neutralized to nonneutralized WNV infected mice. *, P < 0.05; ***, P < 0.001. Bars: (B, i) 200 μM; (B, ii–iv) 50 μM.
Figure 8.
Figure 8.
CCL2 neutralization sequesters Gr1hi monocytes in the BM and blood of WNV-infected mice and prolongs the life of WNV-infected animals. Monocyte populations in the BM (BM-derived monocyte) and peripheral blood (peripheral blood monocyte) were investigated by flow cytometry, based on the expression of EGFP-cFMS in conjunction with a cocktail of antibodies, including CD11b and CD45, using gating strategies indicated in A, B, and C. CCL2 neutralization in WNV-infected EGFP-cFMS chimeras resulted in significant increases in Gr1hi (inflammatory monocytes) in both the BM and peripheral blood (D), as well as significantly prolonging the life of WNV-infected mice (E), compared with WNV-infected mice either treated with isotype control mAb or PBS during infection. Plaque assays (F) showed that CCL2 neutralization had no significant impact on the viral titer on day 7 p.i. Data shown are means ± SD and are representative of two different experiments with four mice per group. Neutralization experiments were analyzed using a two-tailed unpaired t test comparing neutralized to nonneutralized WNV-infected mice. *, P < 0.05; ***, P < 0.001. Kaplan-Meyer survival curves are representative of the results of two separate experiments with 10 mice per group in each. Data were analyzed using Prism Chi test (P < 0.001).

References

    1. Dalmau, I., J.M. Vela, B. Gonzalez, B. Finsen, and B. Castellano. 2003. Dynamics of microglia in the developing rat brain. J. Comp. Neurol. 458:144–157. - PubMed
    1. Fendrick, S.E., K.R. Miller, and W.J. Streit. 2005. Minocycline does not inhibit microglia proliferation or neuronal regeneration in the facial nucleus following crush injury. Neurosci. Lett. 385:220–223. - PubMed
    1. Lytle, J.M., and J.R. Wrathall. 2007. Glial cell loss, proliferation and replacement in the contused murine spinal cord. Eur. J. Neurosci. 25:1711–1724. - PubMed
    1. Pessac, B., I. Godin, and F. Alliot. 2001. Microglia: origin and development. Bull. Acad. Natl. Med. 185:337–346. - PubMed
    1. Djukic, M., A. Mildner, H. Schmidt, D. Czesnik, W. Bruck, J. Priller, R. Nau, and M. Prinz. 2006. Circulating monocytes engraft in the brain, differentiate into microglia and contribute to the pathology following meningitis in mice. Brain. 129:2394–2403. - PubMed

Publication types

MeSH terms