. 2008 Sep 8;182(5):855-63.
doi: 10.1083/jcb.200806076.

Receptor trafficking controls weak signal delivery: a strategy used by c-Met for STAT3 nuclear accumulation

Affiliations

Receptor trafficking controls weak signal delivery: a strategy used by c-Met for STAT3 nuclear accumulation

Stéphanie Kermorgant et al. J Cell Biol. .

Abstract

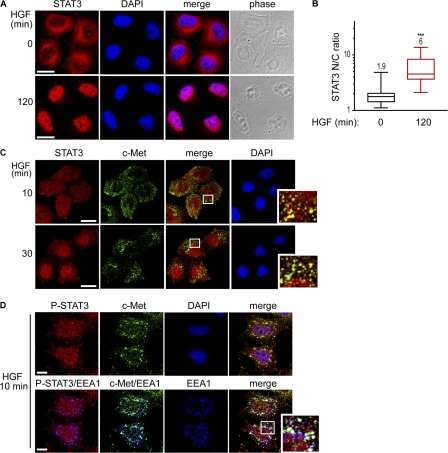
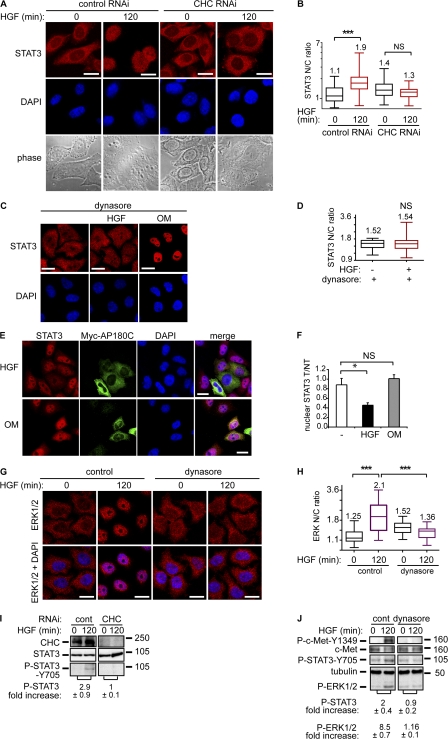
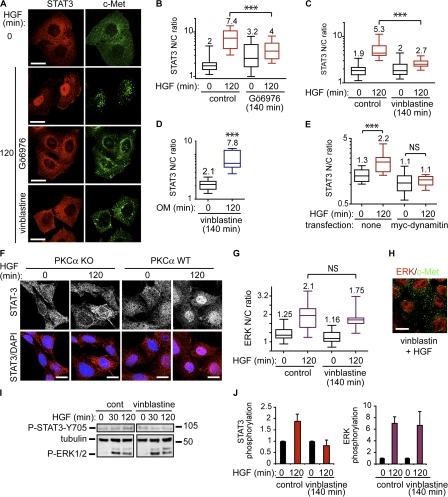
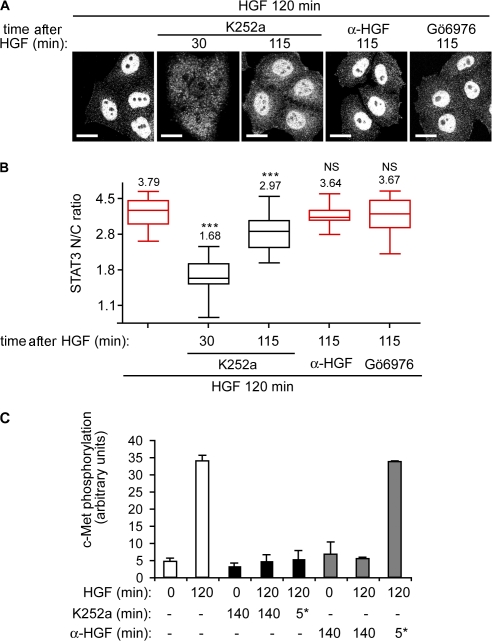
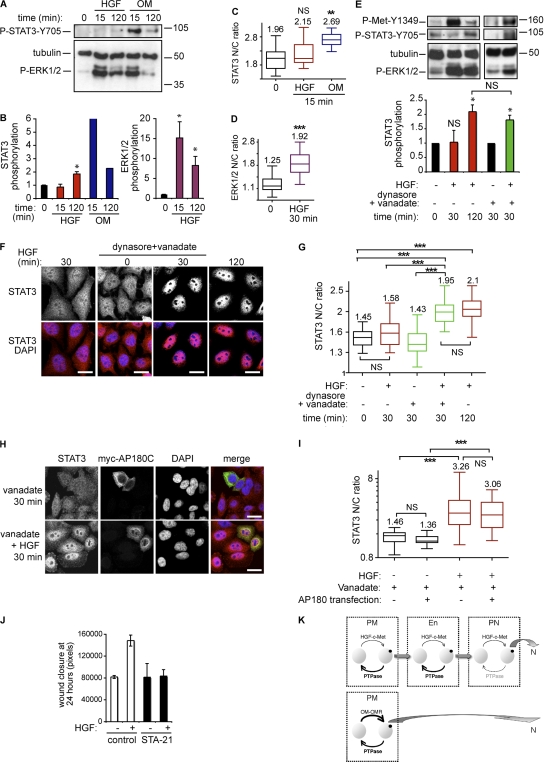
C-Met, the receptor of hepatocyte growth factor (HGF), through overexpression or mutation, is a major protooncogene that provides an attractive molecular target for cancer therapy. HGF/c-Met-induced tumorigenesis is dependent, in part, on the transcription factor and oncogene signal transducer and activator of transcription 3 (STAT3), which is believed to be activated by the receptor at the plasma membrane and then to travel to the nucleus where it acts. We demonstrate that although the robust signal to STAT3 elicited from the cytokine oncostatin-M does indeed support this mechanism of STAT3 action, for the weaker STAT3 signal emanating from c-Met, the activated receptor itself needs to be delivered to a perinuclear endosomal compartment to sustain phosphorylated STAT3 in the nucleus. This is signal specific because c-Met-induced extracellular signal-regulated kinase nuclear accumulation does not require receptor trafficking to the perinuclear compartment. This response is triggered from peripheral endosomes. Thus, control of growth factor receptor traffic determines the nature of the signal output, providing novel opportunities for intervention.


Figures

Figure 1.
Figure 1.
C-Met and STAT3 colocalize on endosomes. (A) Confocal sections of HeLa cells stimulated with HGF for 0 or 120 min and stained for STAT3 and DAPI. Bars, 20 μm. (B) Quantitation of STAT3 nuclear-cytoplasmic ratios (STAT3 N/C ratio) at 0 or 120 min of HGF stimulation. Statistical analyses of five independent experiments are presented as box and whiskers plots (see Statistical analysis of confocal images). The mean values are on top of each box. ***, P < 0.0001. (C) Cells stimulated with HGF for 10 or 30 min were stained for STAT3, c-Met, and DAPI. Confocal sections are shown. Bars, 20 μm. (D) Cells stimulated with HGF for 10 min were stained for P-STAT3 (Y705), c-Met, DAPI, and EEA1. Confocal sections are shown. White boxes define the enlarged areas shown at the right. Bars, 10 μm.
Figure 2.
Figure 2.
STAT3 and ERK1/2 nuclear accumulation is dependent on c-Met endocytosis. In A and B, HeLa cells transfected with control or CHC RNAi were treated by HGF for 0 or 120 min. (A) Confocal projections of cells stained for STAT3 and DAPI. Bars, 20 μm. (B) Quantitation of STAT3 nuclear-cytoplasmic ratios (STAT3 N/C ratio). ***, P < 0.0001. (C) Cells incubated in 80 μM dynasore were not stimulated or stimulated with HGF for 120 min or oncostatin M for 30 min. Confocal sections of cells stained for STAT3 and DAPI. Bars, 20 μm. (D) Quantitation of STAT3 nuclear-cytoplasmic ratios. (E) Confocal projections of five Z sections of cells transfected (T) or not (NT) with myc-AP180C and stained with STAT3, Myc, and DAPI after 120 min of stimulation with HGF or oncostatin M. Bars, 20 μm. (F) Quantitation of STAT3 nuclear intensity in Myc-AP180C T versus NT. The graphs show the nuclear STAT3 accumulation expressed as a ratio (T/NT) for myc-AP180C transfected versus nontransfected cells. The columns are mean values and the error bars are SD. An unpaired t test was performed. *, P < 0.01. (G) Cells were stimulated with HGF for 0 and 120 min in the absence or presence of 80 μM dynasore. Confocal sections of cells stained for ERK1/2 and DAPI are shown. Bars, 20 μm. (H) Quantitation of ERK1/2 nuclear-cytoplasmic ratios. ***, P < 0.0001. (I and J). Cells were treated by HGF for 0 or 120 min. Western blots for CHC, phosphorylated STAT3 (Y705), pan-STAT3, phosphorylated c-Met (tyrosine 1349), pan–c-Met and phosphorylated ERK1/2. The numbers represent fold increase of P-STAT3/STAT3 or P-STAT3/tubulin and P-ERK/tubulin ratios between HGF for 120 and 0 min obtained by densitometry in three independent experiments. (I) Cells were transfected with control or CHC RNAi. (J) Cells were treated or not by 80 μM dynasore. Molecular masses are shown in kD.
Figure 3.
Figure 3.
STAT3, but not ERK1/2, nuclear accumulation is promoted by c-Met microtubule-dependent traffic. (A) HeLa cells stimulated with HGF for 0 or 120 min alone or in the presence of 1 μM Gö6976 or 1 μM vinblastine were stained for STAT3 and c-Met. Confocal sections are shown. Bars, 20 μm. (B and C) Quantitation of STAT3 nuclear-cytoplasmic ratios (STAT3 N/C ratio). ***, P < 0.0001. (D) Quantitation of STAT3 nuclear-cytoplasmic ratios under oncostatin M stimulation for 0 and 120 min in presence of 1 μM vinblastine. ***, P < 0.0001 (pictures not shown). (E) Cells were transfected with myc-dynamitin and stained with STAT3, Myc, and DAPI after 120 min of stimulation with HGF. The plot represents the quantitation of STAT3 nuclear-cytoplasmic ratios in nontransfected and transfected cells. ***, P < 0.0001 (Fig. S2 E [pictures], available at http://www.jcb.org/cgi/content/full/jcb.200806076/DC1). (F) Confocal projections of PKCα knockout or wild-type mouse embryo fibroblasts, stained for STAT3 and DAPI. Bars, 20 μm. (G) Quantitation of ERK1/2 nuclear-cytoplasmic ratios in cells stimulated with HGF for 0 or 120 min in the absence or presence of 1 μM vinblastine. (H) Confocal section of ERK1/2 nuclear localization and endosomal c-Met in cells stimulated with HGF and vinblastine for 120 min. Bar, 20 μm. (I) Cells were stimulated with HGF for 0, 30, or 120 min in the absence or presence of 1 μM vinblastine. Western blots for phosphorylated STAT3 (Y705), tubulin, and phosphorylated ERK1/2. Molecular masses are shown in kD. (J) Densitometric analysis of I. The bars represent fold increase of P-STAT3/tubulin and P-ERK/tubulin ratios between HGF for 120 and 0 min obtained by densitometry in three independent experiments. Error bars represent SEM.
Figure 4.
Figure 4.
STAT3 nuclear accumulation is controlled by c-Met activation in endosomal compartments. (A) Confocal projections of cells stained for STAT3. Cells were stimulated for 120 min with HGF alone or in the presence of K252a or a neutralizing anti-HGF antibody or 1 μM Gö6976, added at 30 or 115 min, i.e., 90 or 5 min before fixation. Bars, 20 μm. (B) Quantitation of STAT3 nuclear-cytoplasmic ratios (STAT3 N/C ratio). ***, P < 0.0002. (C) Phospho–c-Met/tubulin ratios obtained by densitometric analysis of Western blots shown in Fig. S2 (I and J, available at http://www.jcb.org/cgi/content/full/jcb.200806076/DC1). Cells were stimulated with HGF for the times shown. 1 μM K252a or 30 μg/ml of a neutralizing HGF antibody was added for 0 or 140 min or for the final 5 min of HGF stimulation (5*). The graph represents the mean of two independent experiments. Error bars represent ranges.
Figure 5.
Figure 5.
HGF triggers a weak STAT3 signal but a strong ERK1/2 signal. (A) HeLa cells were stimulated for 0, 15, or 120 min with HGF or oncostatin M. Western blot for P-STAT3 (Y705), tubulin, and P-ERK1/2. Molecular masses are shown in kD. (B) Densitometric analysis. The graphs represent the fold increases of P-STAT3/tubulin and P-ERK1/2/tubulin between stimulated and control and is the mean of three and two independent experiments for HGF and oncostatin M stimulation, respectively. Error bars represent SEM. (C) Quantitation of STAT3 nuclear-cytoplasmic ratios (STAT3 N/C ratio) at 0 and 15 min of stimulation with HGF or oncostatin M . **, P < 0.001 (pictures not shown). (D) Quantitation of ERK1/2 nuclear-cytoplasmic ratios at 0 and 30 min of stimulation with HGF. **, P < 0.001 (pictures not shown). (E) Cells were stimulated or not with HGF with or without 80 μM dynasore and 400 μM vanadate for the times indicated. Western Blot for P-c-Met (Y1349), P-STAT3 (Y705), tubulin, and P-ERK1/2. The graph represents P-STAT3/tubulin ratios obtained by densitometric analysis of three independent experiments. Molecular masses are shown in kD. *, P < 0.05. Error bars represent SEM. (F) Cells stimulated for the times indicated with HGF alone or in the presence of 80 μM dynasore and 400 μM vanadate were stained for STAT3 and DAPI. Confocal sections are shown. Bars, 20 μm. (G) Quantitation of STAT3 nuclear-cytoplasmic ratios. ***, P < 0.0001. (H) Confocal projections of five Z sections of cells with or without myc-AP180C and stained with STAT3, myc, and DAPI after 30 min of stimulation with vanadate alone (top) or with HGF (bottom). Bars, 20 μm. (I) Quantitation of STAT3 nuclear-cytoplasmic ratios. ***, P < 0.0001. (J) Quantitation of wound closure. The graph is the mean of two independent experiments performed in duplicate. Error bars represent SD. (K) Model of c-Met and oncostatin M receptor stimulation of STAT3 nuclear accumulation. PM, plasma membrane; En, peripheral endosome; PN, perinuclear endosome; N, nucleus. At the perinuclear location, the proximity of c-Met with the nucleus protects STAT3 against phosphatase activity, allowing a significant increase in nuclear accumulation.

Comment in

Similar articles

Cited by

References

    1. Bild, A.H., J. Turkson, and R. Jove. 2002. Cytoplasmic transport of Stat3 by receptor-mediated endocytosis. EMBO J. 21:3255–3263. - PMC - PubMed
    1. Birchmeier, C., W. Birchmeier, E. Gherardi, and G.F. Vande Woude. 2003. Met, metastasis, motility and more. Nat. Rev. Mol. Cell Biol. 4:915–925. - PubMed
    1. Boccaccio, C., M. Ando, L. Tamagnone, A. Bardelli, P. Michieli, C. Battistini, and P.M. Comoglio. 1998. Induction of epithelial tubules by growth factor HGF depends on the STAT pathway. Nature. 391:285–288. - PubMed
    1. Burkhardt, J.K., C.J. Echeverri, T. Nilsson, and R.B. Vallee. 1997. Overexpression of the dynamitin (p50) subunit of the dynactin complex disrupts dynein-dependent maintenance of membrane organelle distribution. J. Cell Biol. 139:469–484. - PMC - PubMed
    1. Christensen, J.G., J. Burrows, and R. Salgia. 2005. c-Met as a target for human cancer and characterization of inhibitors for therapeutic intervention. Cancer Lett. 225:1–26. - PubMed

Publication types

MeSH terms

Substances