. 2008 Sep 8;182(5):885-96.
doi: 10.1083/jcb.200802084.

Regulation of the endocycle/gene amplification switch by Notch and ecdysone signaling

Affiliations

Regulation of the endocycle/gene amplification switch by Notch and ecdysone signaling

Jianjun Sun et al. J Cell Biol. .

Abstract

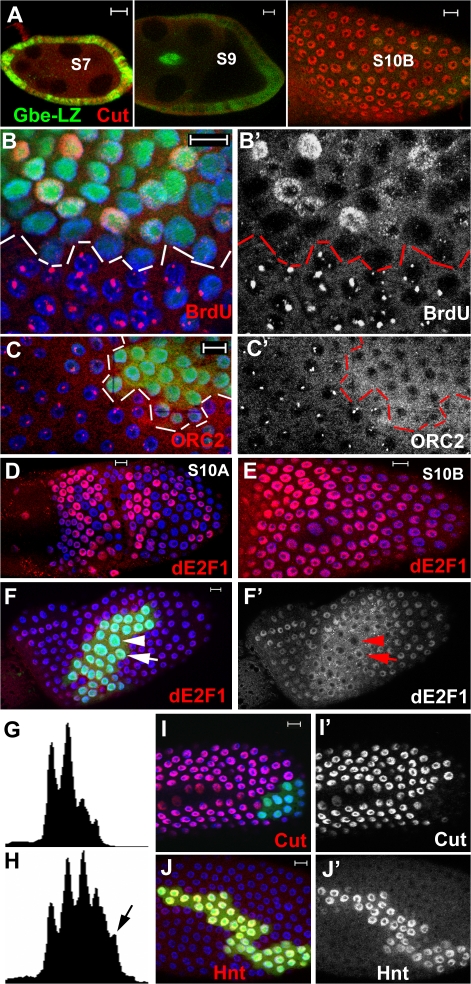
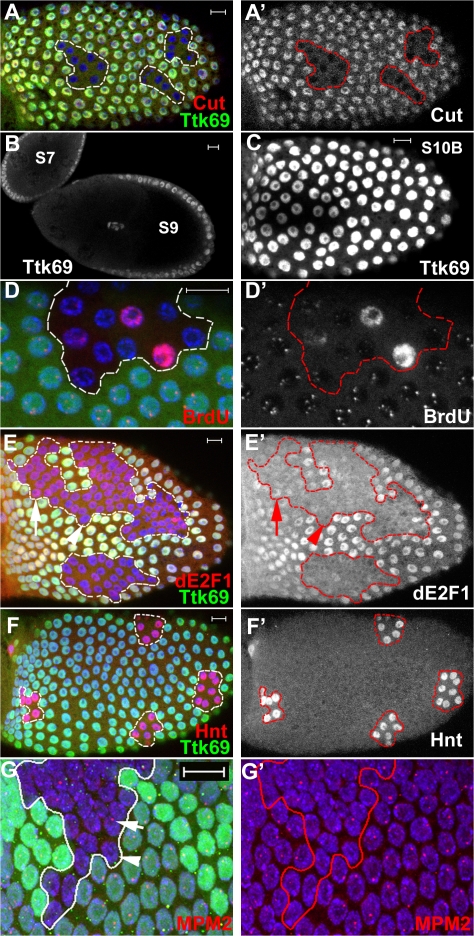
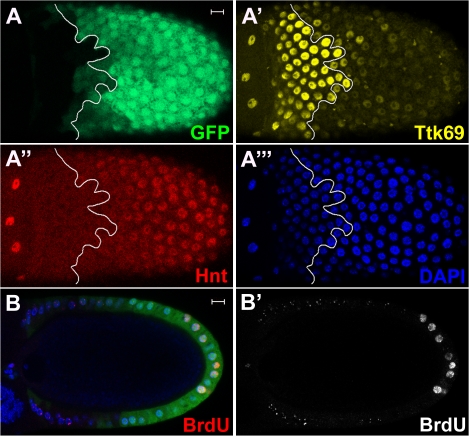
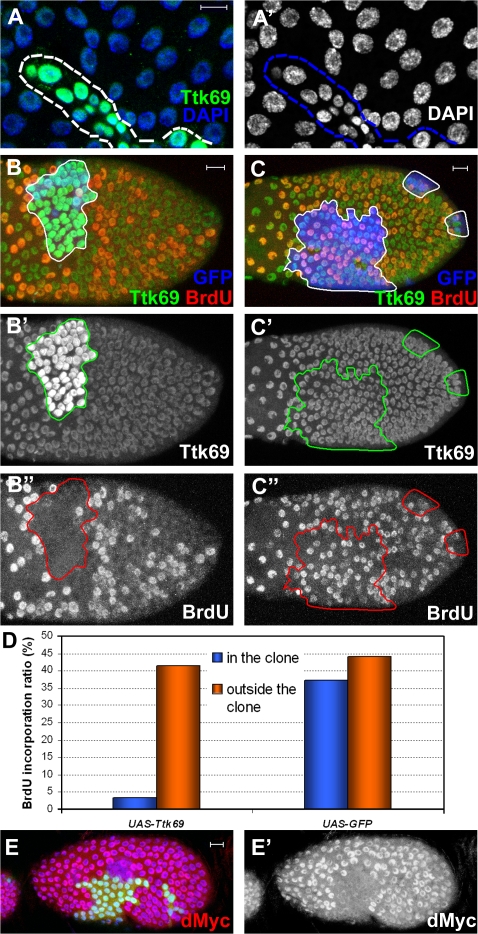
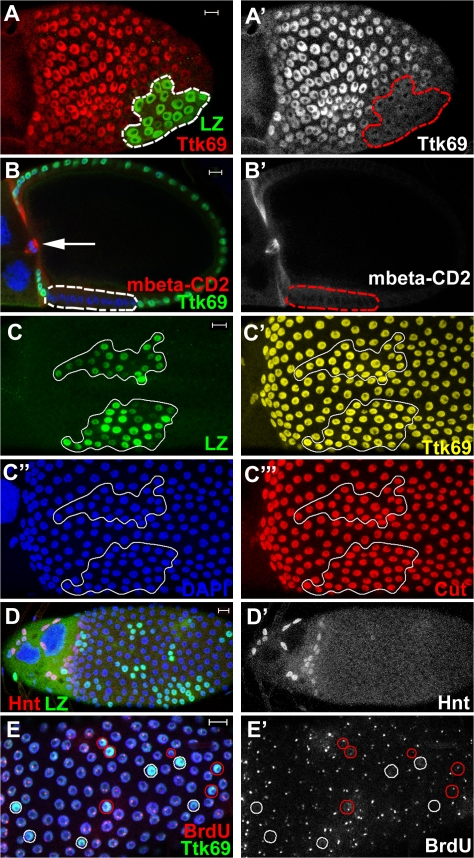
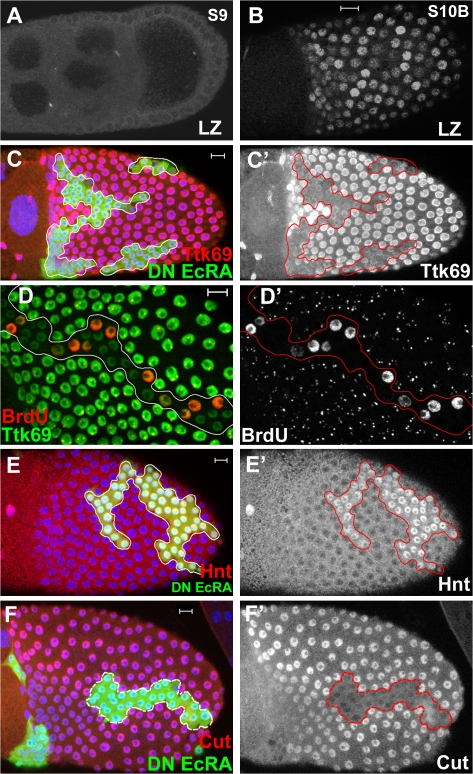
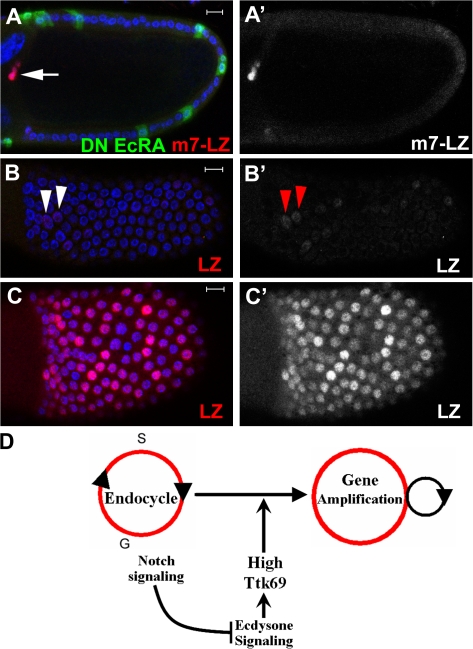
The developmental signals that regulate the switch from genome-wide DNA replication to site-specific amplification remain largely unknown. Drosophila melanogaster epithelial follicle cells, which begin synchronized chorion gene amplification after three rounds of endocycle, provide an excellent model for study of the endocycle/gene amplification (E/A) switch. Here, we report that down-regulation of Notch signaling and activation of ecdysone receptor (EcR) are required for the E/A switch in these cells. Extended Notch activity suppresses EcR activation and prevents exit from the endocycle. Tramtrack (Ttk), a zinc-finger protein essential for the switch, is regulated negatively by Notch and positively by EcR. Ttk overexpression stops endoreplication prematurely and alleviates the endocycle exit defect caused by extended Notch activity or removal of EcR function. Our results reveal a developmental pathway that includes down-regulation of Notch, activation of the EcR, up-regulation of Ttk to execute the E/A switch, and, for the first time, the genetic interaction between Notch and ecdysone signaling in regulation of cell cycle programs and differentiation.


Figures

Figure 1.
Figure 1.
Down-regulation of Notch activity is required for the proper E/A switch and cell differentiation. DAPI (B–F, I, and J; blue) was used to mark cell nuclei. Follicle cells with NICD misexpression are marked by GFP (B, C, F, I, and J; green). Bars, 10 μm. (A) The pattern of Notch activity illustrated by Gbe-lacZ expression (green). Cut staining (red) was used to mark the egg chambers before stage 7 and after stage 10A. (B and B′) Genomic BrdU incorporation (B, red; B′, white) was found in follicle cells with NICD misexpression in a stage 10B egg chamber (top). Dashed outlines separate the follicle cells with NICD overexpression and wild-type cells. Cells above the line are NICD-overexpressing cells. (C and C′) Restricted subnuclear ORC2 localization (C, red; C′, white) was not detected in NICD-misexpressing follicle cells (outlined) in a stage 10B egg chamber. (D and E) dE2F1 showed an oscillating expression pattern in follicle cell nuclei at stage 10A (D) but was accumulated in all follicle cell nuclei at stage 10B (E). (F and F′) dE2F1 (F, red; F′, white) showed an oscillating pattern in NICD-misexpressing follicle cells in a stage 10B egg chamber. Arrows point to follicle cells with dE2F1 staining, and arrowheads point to those without dE2F1 staining. (G and H) Fluorescence-activated cell-sorting analyses of DNA contents in GFP-negative (G, wild type) and GFP-positive (H, NICD misexpressing) follicle cells. The fifth peak, which indicates a 32C DNA content, was found in NICD-misexpressing cells (H, arrow). (I and I′) Cut (I, red; I′, white) was not expressed in NICD-misexpressing follicle cells in a stage 10B egg chamber. (J and J′) Hnt (J, red; J′, white) was continuously expressed in follicle cells with NICD misexpression at stage 10B.
Figure 2.
Figure 2.
Up-regulation of Ttk69 is required for the proper E/A switch and cell differentiation. Images in A and E–G are collapsed images of the z stacks. ttk1e11 mutant clones are marked by the absence of Ttk69 (A, E, and F; green) or GFP (D and G; green). (A and A′) Cut (A, red; A′, white) was not detected in ttk mutant clones (outlined) in a stage 10B egg chamber. (B and C) The expression pattern of Ttk69 in follicle cells. Ttk69 was steadily expressed at a low level in follicle cells before stage 10 (B) but significantly up-regulated at stage 10B (C). (D and D′) ttk mutant follicle cells (outlined) at stage 10B had oscillating genomic BrdU incorporation (D, red; D′, white). (E and E′) dE2F1 (E, red; E′, white) showed an oscillating expression pattern with an overall low level in ttk mutant clones (outlined) in a stage 10B egg chamber. The arrow points to a follicle cell with dE2F1 expression, and the arrowhead points to one without dE2F1 expression. (F and F′) Hnt (F, red; F′, white) was still detected in stage 10B ttk mutant clones. Outlining indicates the ttk mutant follicle cells. (G and G′) MPM2 staining (red) retained an oscillating pattern in ttk mutant clones in a stage 10B egg chamber. The arrow points to a cell with MPM2 signal, and the arrowhead points to a cell without MPM2 signal. Outlining indicates the ttk mutant follicle cells. Bars, 10 μm.
Figure 3.
Figure 3.
Ttk function in late oogenesis is separable from its earlier function. (A–A‴) A stage 10B egg chamber with overexpression of double-stranded RNA targeting ttk mRNA driven by C204 Gal4 driver. UAS-eGFP expression (A, green) indicated a C204 expression pattern, and Ttk69 antibody staining (A′, yellow) confirmed that Ttk69 was knocked down in the posterior half of the egg chamber with strong GFP expression. Hnt staining (A″, red) revealed continuous expression in these follicle cells with low levels of Ttk69. White lines separate follicle cells with ttkRNAi and wild-type cells. (B and B′) Oscillating genomic BrdU incorporation (B, red; B′, white) was found in follicle cells in the posterior half of a stage 10B egg chamber. Bars, 10 μm.
Figure 4.
Figure 4.
Overexpression of Ttk69 causes premature exit from the endocycle. B, C, and E are collapsed images of the z stacks. (A and A′) Cell nuclei (stained with DAPI) in Ttk69-overexpressing follicle cells (A, outlined and green) were much smaller than those in the wild-type cells in a stage 10B egg chamber. (B–B″) A stage 9 egg chamber with Ttk69-overexpressing follicle cells marked by the presence of GFP (B, blue) and high levels of Ttk69 (B, green; B′, white). No or very little BrdU incorporation (B, red; B″, white) was found in these follicle cells (outlined). (C–C″) A control egg chamber with misexpression of GFP (C, blue) but not Ttk69 (C, green; C′, white). The GFP-positive cells (outlined) had normal BrdU incorporation (C, red; C″, white) similar to that of the GFP-negative cells. (D) Quantitative analysis of the BrdU incorporation ratio in the clone area (blue) and outside of the clone (orange) in UAS-Ttk69 and UAS-GFP egg chambers. In total, 235 Tt69-overexpressing and 703 wild-type follicle cells from three UAS-Ttk69 egg chambers were counted. 113 GFP-positive and 236 GFP-negative follicle cells were counted from one UAS-GFP egg chamber (C). (E and E′) dMyc (E, red; E′, white) was down-regulated in Ttk69-misexpressing follicle cells in a stage 8 egg chamber. Bars, 10 μm.
Figure 5.
Figure 5.
The relationship between Notch signaling and Ttk. Images in C–D′ are collapsed images of the z stacks. (A and A′) Ttk69 (A, red; A′, white) was down-regulated in follicle cells with NICD misexpression (outlined and marked by UAS-lacZ expression; A, green) in a stage 10B egg chamber. (B and B′) Notch activity (illustrated by mβ-CD2 expression; B, red; B′, white) was not detected in ttk mutant clones (outlined) in a stage 10B egg chamber. The arrow points to the polar cell/border cell cluster with normal mβ-CD2 expression. (C–C‴) A stage 11 egg chamber with co-overexpression of NICD (outlined and marked by UAS-lacZ expression; C, green) and Ttk69 (C′, yellow). Cut expression (C‴, red) was detected in these follicle cells. (D and D′) Hnt (D, red; D′, white) was not detected in main body follicle cells with co-overexpression of NICD and Ttk69 (marked by UAS-lacZ; D, green) in a stage 11 egg chamber. (E and E′) Site-specific BrdU incorporation (E, red; E′, white) was detected at a low level in some follicle cells with co-overexpression of NICD and Ttk69 (E, green; red circles). The majority of the follicle cells with NICD/Ttk69 co-overexpression (white circles) had no BrdU incorporation. Bars, 10 μm.
Figure 6.
Figure 6.
EcR activity is required for the proper E/A switch and cell differentiation. Images in C, E, and F are collapsed images of the z stacks. Follicle cells with DN EcR-A misexpression were marked by EcR-A staining (C, E, and F; green) or Ttk69 down-regulation (D, green). (A and B) The pattern of EcR activity illustrated by the EcR-LBD-Gal4, UAS-nlacZ system. EcR activity, marked by the LacZ (LZ) expression, was not observed in follicle cells before stage 10 (A), but it was strongly detected in follicle cells at stage 10B and later (B). (C and C′) Ttk69 (C, red; C′, white) was down-regulated in follicle cells with DN EcR-A (outlined) at a stage 10B egg chamber. (D and D′) Oscillating genomic BrdU incorporation (D, red; D′, white) was observed in DN EcR-A–misexpressing follicle cells (outlined) in a stage 10B egg chamber. (E and E′) Hnt (E, red; E′, white) was still detected in follicle cells with DN EcR-A (outlined) at stage 10B. (F and F′) Cut (F, red; F′, white) was not detected in follicle cells with DN EcR-A (outlined) in a stage 10B egg chamber. Bars, 10 μm.
Figure 7.
Figure 7.
Notch signaling antagonizes EcR activity during the E/A switch. (A and A′) Notch activity (marked by m7-lacZ expression; A, red; A′, white) was not detected in follicle cells with DN EcR-A (A, green) in a stage 10B egg chamber or in the adjacent wild type. The arrow points to the polar cells with m7-lacZ expression. (B and B′) EcR activity (illustrated by the LBD-Gal4, UAS-nlacZ expression; B, red; B′, white) was dramatically suppressed in follicle cells with NICD misexpression driven by the hsp70 promoter in a stage 10B egg chamber. The arrowheads point to follicle cells with weak EcR activity. (C and C′) A control egg chamber without NICD misexpression during the same stage had high levels of EcR activity (C, red; C′, white) in follicle cells. Red channels in B and C had the same settings when the images were acquired. (D) A schematic drawing of the involvement of Notch and ecdysone signaling and high levels of Ttk69 in the E/A switch. Bars, 10 μm.

Similar articles

Cited by

References

    1. Aggarwal, B.D., and B.R. Calvi. 2004. Chromatin regulates origin activity in Drosophila follicle cells. Nature. 430:372–376. - PubMed
    1. Assa-Kunik, E., I.L. Torres, E.D. Schejter, D.S. Johnston, and B.Z. Shilo. 2007. Drosophila follicle cells are patterned by multiple levels of Notch signaling and antagonism between the Notch and JAK/STAT pathways. Development. 134:1161–1169. - PubMed
    1. Audibert, A., F. Simon, and M. Gho. 2005. Cell cycle diversity involves differential regulation of Cyclin E activity in the Drosophila bristle cell lineage. Development. 132:2287–2297. - PubMed
    1. Badenhorst, P. 2001. Tramtrack controls glial number and identity in the Drosophila embryonic CNS. Development. 128:4093–4101. - PubMed
    1. Beall, E.L., J.R. Manak, S. Zhou, M. Bell, J.S. Lipsick, and M.R. Botchan. 2002. Role for a Drosophila Myb-containing protein complex in site-specific DNA replication. Nature. 420:833–837. - PubMed

Publication types

MeSH terms

LinkOut - more resources