

Measuring cerebral atrophy and white matter hyperintensity burden to predict the rate of cognitive decline in Alzheimer disease
- PMID: 18779424
- PMCID: PMC2629007
- DOI: 10.1001/archneur.65.9.1202
Measuring cerebral atrophy and white matter hyperintensity burden to predict the rate of cognitive decline in Alzheimer disease
Abstract
Objective: To determine if baseline measurements of cerebral atrophy and severity of white matter hyperintensity (WMH) predict the rate of future cognitive decline in patients with Alzheimer disease (AD).
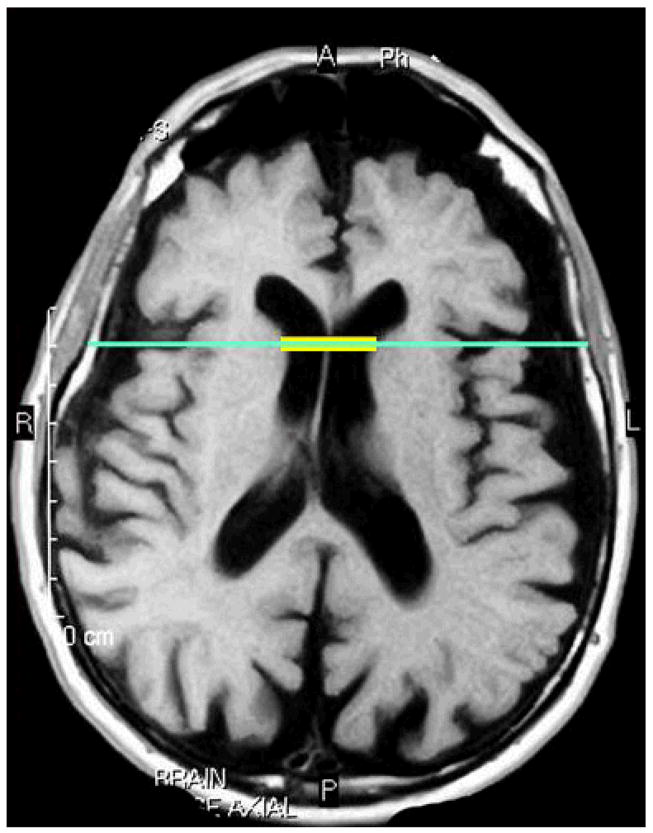
Design: Data were drawn from the Predictors Study, a longitudinal study that enrolls patients with mild AD and reassesses them every 6 months with use of the Columbia modified Mini-Mental State (mMMS) examination (score range, 0-57). Magnetic resonance images were analyzed to determine the severity of WMH, using the Scheltens scale, and the degree of atrophy, using the bicaudate ratio. Generalized estimating equations were used to determine whether severity of baseline magnetic resonance image measurements and their interaction predicted the rate of mMMS score decline at subsequent visits.
Setting: Three university-based AD centers in the United States.
Participants: At baseline, 84 patients with AD from the Predictors Study received structural magnetic resonance imaging and were selected for analysis. They had a mean of 6 follow-up evaluations. Main Outcome Measure The mMMS score.
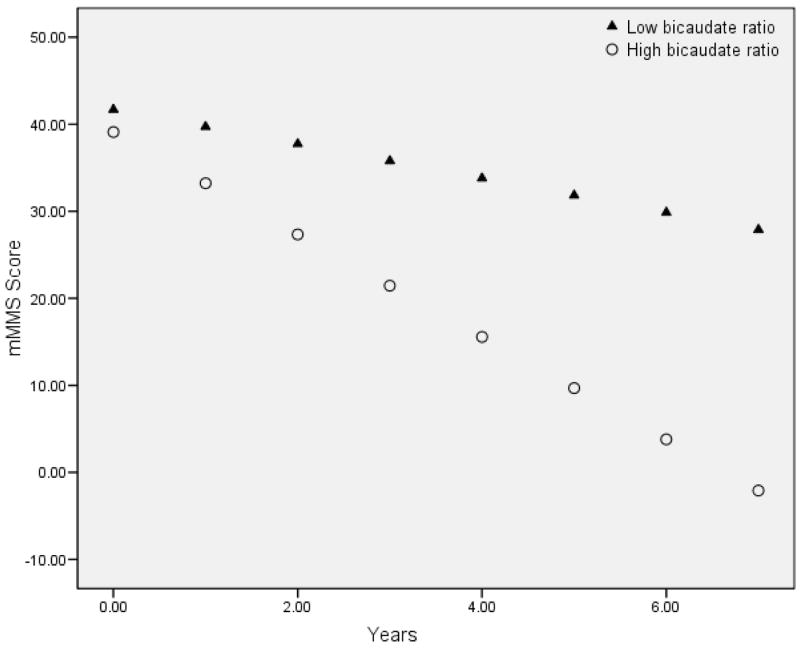
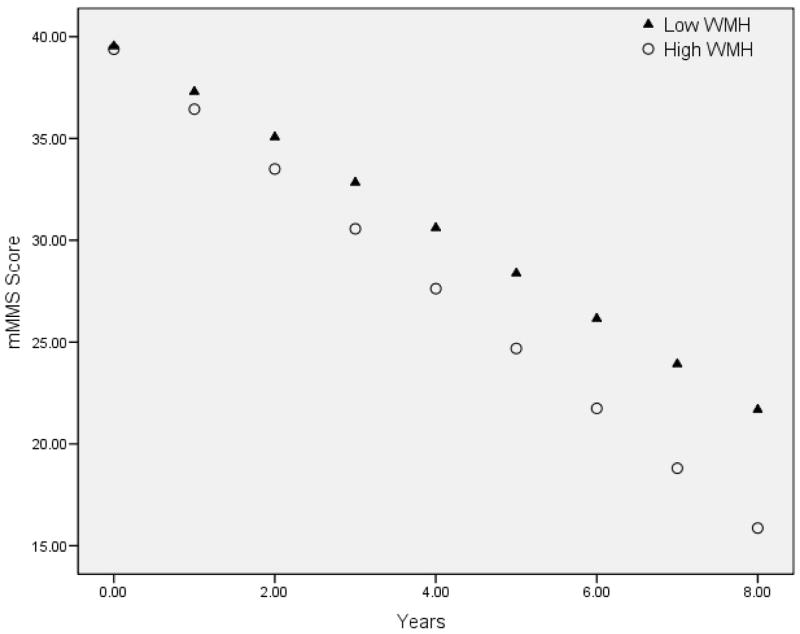
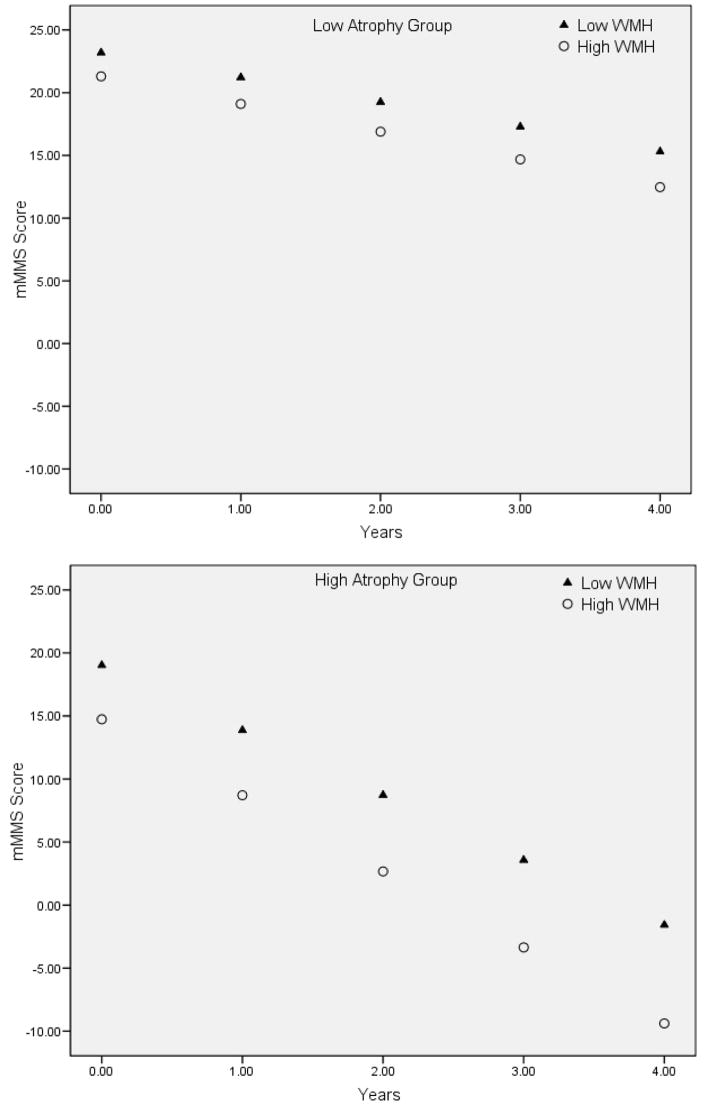
Results: Generalized estimating equation models demonstrated that the degree of baseline atrophy (beta = -0.316; P = .04), the severity of WMH (beta = -0.173; P = .03), and their interaction (beta = -6.061; P = .02) predicted the rate of decline in mMMS scores.
Conclusions: Both degree of cerebral atrophy and severity of WMH are associated with the rapidity of cognitive decline in AD. Atrophy and WMH may have a synergistic effect on future decline in AD, such that patients with a high degree of both have a particularly precipitous cognitive course. These findings lend further support to the hypothesis that cerebrovascular pathological abnormalities contribute to the clinical syndrome of AD.
Conflict of interest statement
Disclosures: The authors report no conflicts of interest.
Figures
References
-
- Brickman AM, Buchsbaum MS. Alzheimer’s disease and normal aging: Neurostructures. In: Byrne J, editor. Learning and Memory: A Comprehensive Review. New York: Elsevier; in press.
-
- Murphy DG, DeCarli CD, Daly E, et al. Volumetric magnetic resonance imaging in men with dementia of the Alzheimer type: correlations with disease severity. Biol Psychiatry. 1993 Nov 1;34(9):612–621. - PubMed
-
- Fox NC, Freeborough PA, Rossor MN. Visualisation and quantification of rates of atrophy in Alzheimer’s disease. Lancet. 1996 Jul 13;348(9020):94–97. - PubMed
-
- Chan D, Fox NC, Jenkins R, Scahill RI, Crum WR, Rossor MN. Rates of global and regional cerebral atrophy in AD and frontotemporal dementia. Neurology. 2001 Nov 27;57(10):1756–1763. - PubMed
Publication types
MeSH terms
Grants and funding
LinkOut - more resources
Full Text Sources
Medical
