. 2008 Sep 16;105(37):14136-40.
doi: 10.1073/pnas.0804982105. Epub 2008 Sep 8.

Spatial organization of a replicating bacterial chromosome

Affiliations

Spatial organization of a replicating bacterial chromosome

Idit Anna Berlatzky et al. Proc Natl Acad Sci U S A. .

Abstract

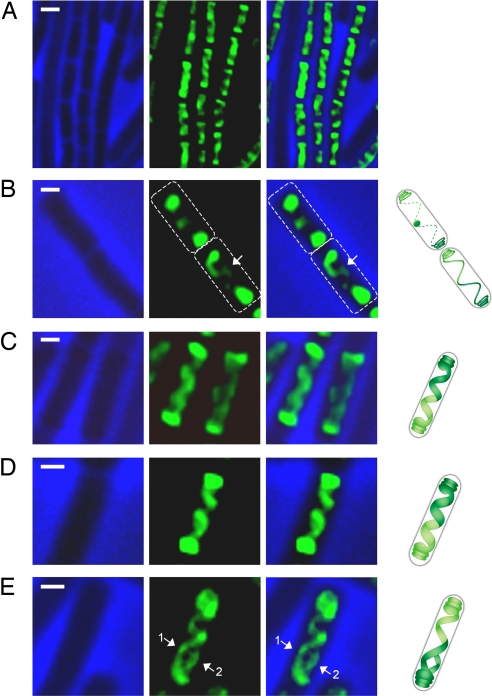
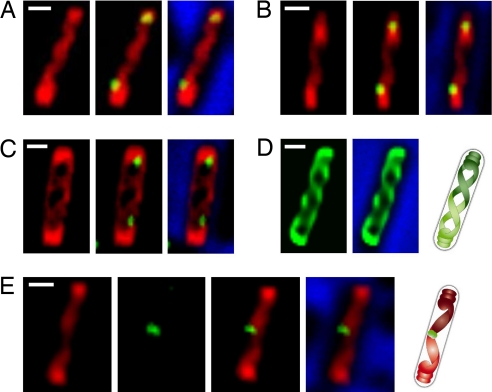
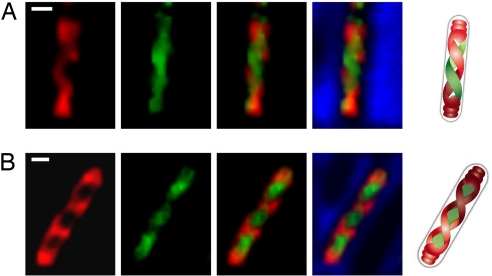
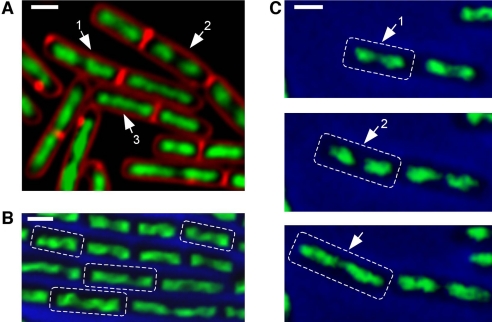
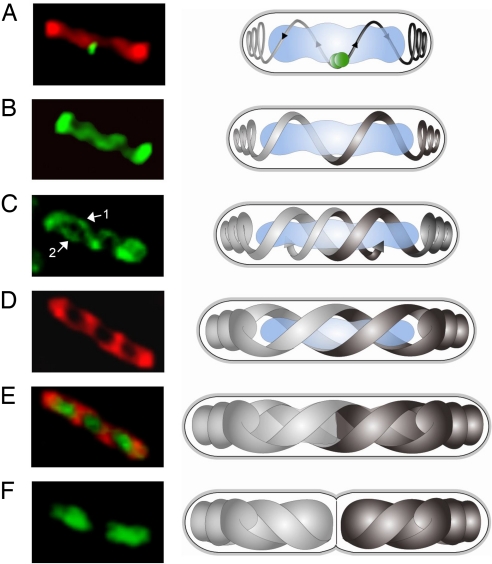
Emerging evidence indicates that the global organization of the bacterial chromosome is defined by its physical map. This architectural understanding has been gained mainly by observing the localization and dynamics of specific chromosomal loci. However, the spatial and temporal organization of the entire mass of newly synthesized DNA remains elusive. To visualize replicated DNA within living cells, we developed an experimental system in the bacterium Bacillus subtilis whereby fluorescently labeled nucleotides are incorporated into the chromosome as it is being replicated. Here, we present the first visualization of replication morphologies exhibited by the bacterial chromosome. At the start of replication, newly synthesized DNA is translocated via a helical structure from midcell toward the poles, where it accumulates. Next, additionally synthesized DNA forms a second, visually distinct helix that interweaves with the original one. In the final stage of replication, the space between the two helices is filled up with the very last synthesized DNA. This striking geometry provides insight into the three-dimensional conformation of the replicating chromosome.


Conflict of interest statement

The authors declare no conflict of interest.

Figures

Fig. 1.
Fig. 1.
Visualizing localization patterns of newly replicated DNA. (A) A growing culture of B. subtilis cells (PY79) was treated with fluorescent nucleotides and photographed 2 h after the start of detectable incorporation (Materials and Methods and SI Text). Cells were observed with phase-contrast microscopy (blue, Left), and the localization of the incorporated nucleotides was observed by fluorescence microscopy (green, Center). (Right) An overlay of the signals from fluorescent nucleotides and phase contrast. Note that the nucleotides were not incorporated into the DNA of all of the cells in the field. (Scale bar: 1 μm.) (B–E) A growing culture of B. subtilis cells (PY79) was treated with fluorescent nucleotides (Materials and Methods and SI Text) and photographed at 30-min intervals after the start of detectable incorporation. Shown are typical localization patterns of the fluorescent nucleotides (green) observed from early until late stages of replication (B to E, respectively). Cells are shown by phase-contrast microscopy (blue). (Right) Interpretive cartoons in which the two copies of the newly synthesized DNA are represented by different tones of green. The dashed line in B illustrates cell borders, and the arrow highlights the filament connecting the polar foci. Arrows in E indicate the position of the two helices: initial helix (1) and sequential helix (2). (Scale bars: 0.5 μm.)
Fig. 2.
Fig. 2.
Temporal and spatial organization of the replicating chromosome. (A–C) Visualization of the origin regions with the newly replicated DNA. Fluorescent nucleotides were added to a growing culture of B. subtilis cells (SB294), producing a GFP fusion to Spo0J that binds to the origin regions; cells were photographed at 30-min intervals after the start of detectable incorporation (Materials and Methods and SI Text). The localization of Spo0J-GFP was observed with respect to the different stages of replication. Shown are fluorescence from the incorporated nucleotides (red), fluorescence from Spo0J-GFP (green), and bacterial cells by phase contrast (blue). (D) Deconvolution microscopy revealing the interweaving helices formed by the newly replicated DNA. A growing culture of B. subtilis cells (PY79) was treated with fluorescent nucleotides, and optical sections were collected 2 h after the start of detectable incorporation (Materials and Methods and SI Text). Shown is deconvolution microscopy of the fluorescent signal from a typical cell revealing the three-dimensional structure of the two interweaving helices. The deconvolved image of the fluorescent signal is shown in green, and the cell outline is shown by phase contrast (blue). The image on the right shows an interpretive cartoon in which the two copies of the newly synthesized DNA are represented by different tones of green. (E) Visualization of DNA polymerase with the newly replicated DNA. Fluorescent nucleotides were added to a growing culture of B. subtilis cells (IB66), producing a GFP fusion to the τ DNA polymerase subunit (Materials and Methods and SI Text). Fluorescence from the incorporated nucleotides is shown in red, and fluorescence from GFP is shown in green. Also shown are overlay images of signals from fluorescent nucleotides and GFP with or without phase contrast (blue). The image on the right shows an interpretive cartoon in which the two copies of the newly synthesized DNA are represented by different tones of red, and the replisome is labeled in green. (Scale bars: 0.5 μm.)
Fig. 3.
Fig. 3.
Differentiating early from late replicated DNA. (A and B) Red fluorescent nucleotides were added to a growing culture of B. subtilis cells (PY79). One hour after incorporation was visible, the unincorporated red nucleotides were washed away, and green fluorescent nucleotides were added sequentially (Materials and Methods and SI Text). Shown are typical localization patterns of incorporated fluorescent nucleotides (red and green) observed when both nucleotides were incorporated into the DNA of the same cell. Also shown are overlay images of red and green signals from fluorescent nucleotides with or without phase contrast (blue). The images on the right show interpretive cartoons in which the two copies of early replicated DNA are represented by different tones of red, and the two copies of late replicated DNA are represented by different tones of green. (Scale bars: 0.5 μm.)
Fig. 4.
Fig. 4.
Visualizing the chromosome structure during replication and segregation in living cells. (A) A typical field of growing B. subtilis cells (PY79) stained with DAPI (green) and FM4–64 membrane stain (red). The arrows highlight different typical morphologies of the nucleoid observed with DAPI staining: (1) bilobed nucleoid where the chromosomes are close to segregation, (2) fully segregated chromosomes, and (3) nucleoid forming a helical structure. (B) A typical field of growing B. subtilis cells (MF60) producing a GFP fusion to a RNA polymerase subunit (rpoC-gfp). Shown is an overlay image of signals from RpoC-GFP (green) and phase contrast (blue). The dashed lines highlights cells in which morphologies of the nucleoid resemble helical structures. (C) Time-lapse microscopy of MF60 (rpoC-gfp) cells. Cells were grown in minimal medium at 30°C. Shown are overlays of signals from RpoC-GFP (green) with phase-contrast images (blue) at 20-min intervals. Cell borders are indicated by the dashed lines, and the arrows highlight the different morphologies of the nucleoid as indicated in A. See corresponding Movie S1. (Scale bars: 1 μm.)
Fig. 5.
Fig. 5.
A model for the geometry of the replicating chromosome in bacteria. (Right) Cartoons demonstrating our model for the geometry of the replicating chromosome. The two copies of the newly synthesized chromosomes are represented by the different tones of gray, the unreplicated chromosome is shown in light blue, and the replisome is shown in green. Arrowheads in A indicate the direction in which DNA is translocated after being replicated at midcell. (Left) The actual images of the corresponding stages illustrated by the cartoon model: Fig. 2E (A), Fig. 1C (B), Fig. 1E (C), Fig. 3B (D), Fig. 3B (E), and Fig. 4C (F).

Similar articles

Cited by

References

    1. Cooper S, Helmstetter CE. Chromosome replication and the division cycle of Escherichia coli B/r. J Mol Biol. 1968;31:519–540. - PubMed
    1. Hazan R, Ben-Yehuda S. Resolving chromosome segregation in bacteria. J Mol Microbiol Biotechnol. 2006;11:126–139. - PubMed
    1. Hiraga S. Dynamic localization of bacterial and plasmid chromosomes. Annu Rev Genet. 2000;34:21–59. - PubMed
    1. Lemon KP, Grossman AD. The extrusion-capture model for chromosome partitioning in bacteria. Genes Dev. 2001;15:2031–2041. - PubMed
    1. Nielsen HJ, Li Y, Youngren B, Hansen FG, Austin S. Progressive segregation of the Escherichia coli chromosome. Mol Microbiol. 2006;61:383–393. - PubMed

Publication types

MeSH terms