. 2008 Sep 16;105(37):13977-81.
doi: 10.1073/pnas.0805965105. Epub 2008 Sep 8.

Accelerated evolution of resistance in multidrug environments

Affiliations

Accelerated evolution of resistance in multidrug environments

Matthew Hegreness et al. Proc Natl Acad Sci U S A. .

Abstract

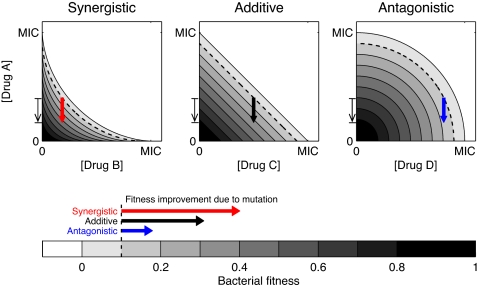
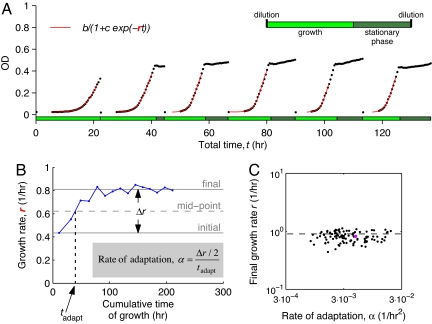
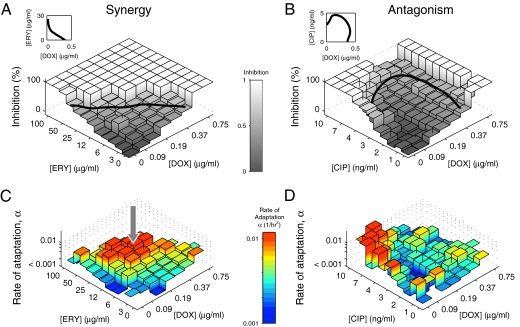
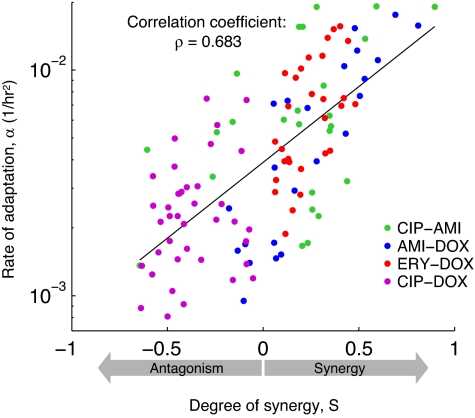
The emergence of resistance during multidrug chemotherapy impedes the treatment of many human diseases, including malaria, TB, HIV, and cancer. Although certain combination therapies have long been known to be more effective in curing patients than single drugs, the impact of such treatments on the evolution of drug resistance is unclear. In particular, very little is known about how the evolution of resistance is affected by the nature of the interactions--synergy or antagonism--between drugs. Here we directly measure the effect of various inhibitory and subinhibitory drug combinations on the rate of adaptation. We develop an automated assay for monitoring the parallel evolution of hundreds of Escherichia coli populations in a two-dimensional grid of drug gradients over many generations. We find a correlation between synergy and the rate of adaptation, whereby evolution in more synergistic drug combinations, typically preferred in clinical settings, is faster than evolution in antagonistic combinations. We also find that resistance to some synergistic combinations evolves faster than resistance to individual drugs. The accelerated evolution may be due to a larger selective advantage for resistance mutations in synergistic treatments. We describe a simple geometric model in which mutations conferring resistance to one drug of a synergistic pair prevent not only the inhibitory effect of that drug but also its enhancing effect on the other drug. Future study of the profound impact that synergy and other drug-pair properties can have on the rate of adaptation may suggest new treatment strategies for combating the spread of antibiotic resistance.


Conflict of interest statement

The authors declare no conflict of interest.

Figures

Fig. 1.
Fig. 1.
A simple geometric model shows that a mutation conferring resistance to a single drug is most advantageous in a synergistic drug combination. Shown are isoboles, or lines of equal bacterial growth rate, in the plane of concentrations of drugs A with either drug B (where B interacts with drug A synergistically), drug C (additively), or drug D (antagonistically). The arrows shown on the isobolograms for the three types of interaction all correspond to the exact same mutation (indicated by a thin arrow along the axis of drug A's concentration), which confers partial resistance to drug A by reducing the effective concentration of drug A felt by the resistant mutant. The three arrows' origins represent environments that have the same initial concentration of drug A and the same fitness inhibition (10%, dotted line). Although the mutation changes the effective concentration of drug A by the same amount in all environments, the fitness gain conferred by the mutation is greatest in the synergistic case (it crosses more fitness contour lines).
Fig. 2.
Fig. 2.
Parallel quantitative measurement of the rate of adaptation in multidrug environments. (A) Example of growth in one particular dosage of ciprofloxacin (CIP) and doxycycline (DOX), showing measurements of optical density as a function of time (OD, black dots). Cells are propagated in media containing the drugs through daily serial transfers over 15 days (only the first 6 days are shown), resulting in alternating periods of growth and stationary phase (Inset). Best fit of the logistic growth curve (red lines; indicated equation) defines the growth rate (r) for this population in each day. The measurement error in the growth rates was estimated to be ≈0.06/h (see Materials and Methods and Fig. S3). (B) Data points corresponding to daily growth rates show how the fitness in the population from A increases over time. Time is measured in hours of growth (time in stationary phase is excluded). The total increase in growth rate of the population is denoted by Δr, and the adaptation time, tadapt, is defined as the time at which the population crosses the midpoint between its initial and final growth rates (see Materials and Methods for more details). Measured Δr and tadapt are used for determining the rate of adaptation of each population (α, equation shown). (C) Scatter plot of rates of adaptation and final growth rates for CIP-DOX and ERY-DOX. The point highlighted in magenta corresponds to the population shown in A and B. Most populations that evolve recover the growth rate in a drug-free environment (dashed horizontal line).
Fig. 3.
Fig. 3.
Different drug pairs vary profoundly in their impact on the rate of adaptation. (A and B) For two pairs of drugs (A, synergistic ERY-DOX; B, antagonistic CIP-DOX), the initial level of inhibition is shown for a matrix of concentrations of the two drugs. The level of inhibition is defined as 1r/r0, where r is the growth rate of the population in the presence of antibiotics and r0 is the drug-free growth rate. The solid line corresponds to the line of 50% inhibition and is also shown on a linear scale in the insets (see Fig. 1 for comparison). (C and D) The rate of adaptation for the drug combinations shown in A and B. The arrow in C points to a region of drug concentrations where the rate of adaptation for the synergistic ERY-DOX combination is accelerated relative to the single-drug treatments. This acceleration is surprising because the more expected outcome of combining drugs is for adaptation to slow down.
Fig. 4.
Fig. 4.
The degree of synergy and the rate of adaptation are positively correlated: The more synergistically the drugs interact, the faster the bacteria evolve resistance. Shown are data from all four drug pairs in our study (legend). Each dot represents the rate of adaptation for a given drug pair and concentrations versus the degree of synergy (S). The variability in rates of adaptation has two contributions: an error of approx 25% due to errors in measuring growth rates, and an inherent stochasticity of the mutation process (see Materials and Methods and Figs. S3 and S4). For a combination (x,y) of drug concentrations, S is measured as the deviation from the neutral expectation defined by Bliss independence: S = (fx0/f00)(f0y/f00) − fxy/f00, where fxy denotes wild-type growth rates when the concentration of one drug is x and that of the other is y. Following this definition, positive values of S corresponds to synergistic interactions and negative values to antagonistic ones. The solid line is the best fit to all 116 data points from all of the drug pairs.

Similar articles

Cited by

References

    1. Daniels M, Hill AB. Chemotherapy of pulmonary tuberculosis in young adults - An analysis of the combined results of 3 Medical Research Council trials. Brit Med J. 1952;1:1162–1168. - PMC - PubMed
    1. Klastersky J, Cappel R, Daneau D. Clinical significance of in-vitro synergism between antibiotics in gram-negative infections. Antimicrob Agents Chemother. 1972;2:470–475. - PMC - PubMed
    1. Davies J, Wright GD. Bacterial resistance to aminoglycoside antibiotics. Trends Microbiol. 1997;5:234–240. - PubMed
    1. Smith RD, Coast J. Antimicrobial resistance: A global response. Bull World Health Organ. 2002;80:126–133. - PMC - PubMed
    1. Walsh C. Antibiotics: Actions, Origins, Resistance. Washington, DC: American Society for Microbiology Press; 2003.

Publication types

MeSH terms

LinkOut - more resources