. 2008 Sep 16;105(37):13764-8.
doi: 10.1073/pnas.0803917105. Epub 2008 Sep 8.

Neanderthal brain size at birth provides insights into the evolution of human life history

Affiliations

Neanderthal brain size at birth provides insights into the evolution of human life history

Marcia S Ponce de León et al. Proc Natl Acad Sci U S A. .

Abstract

From birth to adulthood, the human brain expands by a factor of 3.3, compared with 2.5 in chimpanzees [DeSilva J and Lesnik J (2006) Chimpanzee neonatal brain size: Implications for brain growth in Homo erectus. J Hum Evol 51: 207-212]. How the required extra amount of human brain growth is achieved and what its implications are for human life history and cognitive development are still a matter of debate. Likewise, because comparative fossil evidence is scarce, when and how the modern human pattern of brain growth arose during evolution is largely unknown. Virtual reconstructions of a Neanderthal neonate from Mezmaiskaya Cave (Russia) and of two Neanderthal infant skeletons from Dederiyeh Cave (Syria) now provide new comparative insights: Neanderthal brain size at birth was similar to that in recent Homo sapiens and most likely subject to similar obstetric constraints. Neanderthal brain growth rates during early infancy were higher, however. This pattern of growth resulted in larger adult brain sizes but not in earlier completion of brain growth. Because large brains growing at high rates require large, late-maturing, mothers [Leigh SR and Blomquist GE (2007) in Campbell CJ et al. Primates in perspective; pp 396-407], it is likely that Neanderthal life history was similarly slow, or even slower-paced, than in recent H. sapiens.


Conflict of interest statement

The authors declare no conflict of interest.

Figures

Fig. 1.
Fig. 1.
Virtual reconstruction of the Mezmaiskaya Neanderthal. (A) Skeleton. (B) Skull in right lateral view. (Scale bars, 5 cm.)
Fig. 2.
Fig. 2.
Geometric morphometric analysis of shape variability in a sample of immature Neanderthal and rAMHS crania. PC1 and PC2 are the first two shape components, which account for 27% and 13% of the total shape variability in the sample, respectively. PC1 captures shape change during cranial development in both Neanderthals and rAMHS, whereas PC2 captures major differences in cranial morphology between Neanderthals and AMHS. Filled symbols: Neanderthal specimens [M, Mezmaiskaya (four reconstructive variants enclosed in 95% density ellipse); P, Pech de l'Azé; D1 and D2, Dederiyeh 1 and 2; S, Subalyuk 2; E, Engis 2; R, Roc de Marsal; G, Gibraltar 2]. Open symbols: rAMHS (mixed European/African/Asian sample). Diamonds: fetuses; circles: neonates; triangles: 0.5 to <3 years; squares: 3 years to ≤5.5 years.
Fig. 3.
Fig. 3.
Reconstruction of Neanderthal birth (crossed stereo pictures). The pelvic reconstruction combines elements of the Tabun 1 specimen (ilium, ischium, pubis) with their mirror-imaged counterparts (transparent), and replacement parts (violet) from a modern human female pelvis (sacrum, ischial spines). The Mezmaiskaya skull is visualized during its passage through the pelvic inlet. (Scale bar, 10 cm.) (See also SI Text, Virtual Reconstruction of a Female Neanderthal Pelvis and Figs. S4 and S5).
Fig. 4.
Fig. 4.
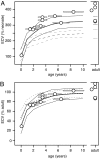
Postnatal endocranial volume (ECV) growth in Neanderthals, rAMHS, and chimpanzees. (A) Growth as a percentage of neonate taxon-specific mean ECV values (Neanderthals: 400 ccm, rAMHS: 400 ccm, chimpanzees: 155 ccm). (B) Growth as a percentage of adult taxon-specific mean ECV values (1,500 ccm, 1,350 ccm, 386 ccm). Solid lines: rAMHS mean ± SD; dashed lines: chimpanzee mean ± SD (data from refs. , , and 49). Circles: Neanderthal individuals (from left to right and bottom to top: Mezmaiskaya, Dederiyeh 1 and 2, Pech de l'Azé, Subalyuk 2, Roc de Marsal, Gibraltar 2, Engis 2, La Quina 18, Teshik Tash, Le Moustier 1, Tabun 1, Gibraltar 1, La Ferrassie 1, Amud 1); horizontal bars: estimated range of individual age. In A, note that Neanderthals are at the upper range of the rAMHS distribution. In B, note complete overlap between Neanderthal and rAMHS trajectories, and overlap between chimpanzee and hominin trajectories after an age of 2 years.

References

    1. Smith BH, Tompkins RL. Toward a life history of the Hominidae. Ann Rev Anthropol. 1995;24:257–279.
    1. Leigh SR. Brain growth, life history, and cognition in primate and human evolution. Am J Primatol. 2004;62:139–164. - PubMed
    1. Vinicius L. Human encephalization and developmental timing. J Hum Evol. 2005;49:762–776. - PubMed
    1. Leigh SR. Brain ontogeny and life history in Homo erectus. J Hum Evol. 2006;50:104–108. - PubMed
    1. Leigh SR, Blomquist GE. In: Primates in Perspective. Campbell CJ, Fuentes A, MacKinnon KC, Panger M, Bearder SK, editors. Oxford, UK: Oxford Univ Press; 2007. pp. 396–407.

Publication types