. 2008 Sep 16;105(37):13901-5.
doi: 10.1073/pnas.0806983105. Epub 2008 Sep 8.

A fluorescent reporter of caspase activity for live imaging

Affiliations

A fluorescent reporter of caspase activity for live imaging

Pierre-Luc Bardet et al. Proc Natl Acad Sci U S A. .

Abstract

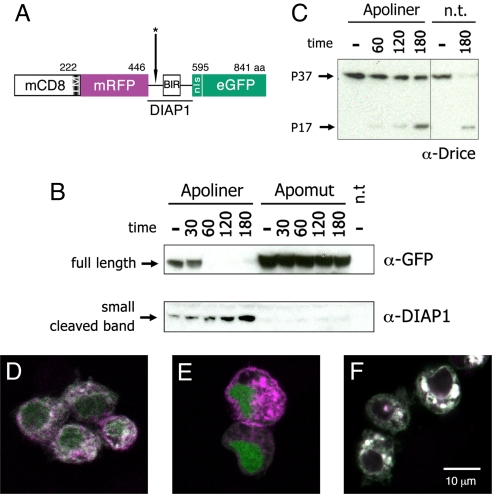
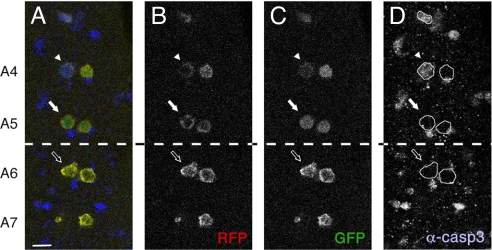
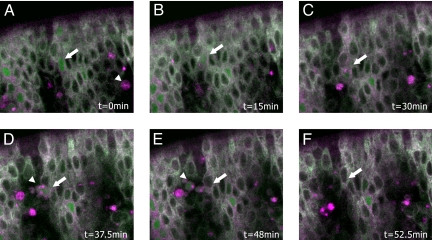
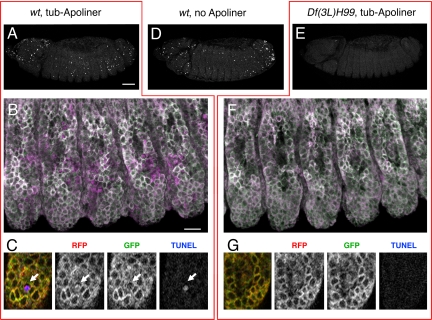
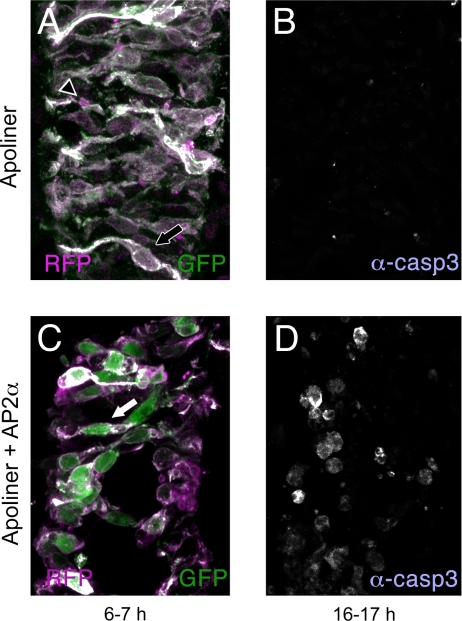
There is a growing interest in the mechanisms that control the apoptosis cascade during development and adult life. To investigate the regulatory events that trigger apoptosis in whole tissues, we have devised a genetically encoded caspase sensor that can be detected in live and fixed tissue by standard confocal microscopy. The sensor comprises two fluorophores, mRFP, monomeric red fluorescent protein (mRFP) and enhanced green fluorescent protein (eGFP), that are linked by an efficient and specific caspase-sensitive site. Upon caspase activation, the sensor is cleaved and eGFP translocates to the nucleus, leaving mRFP at membranes. This is detected before other markers of apoptosis, including anti-cleaved caspase 3 immunoreactivity. Moreover, the sensor does not perturb normal developmental apoptosis and is specific, as cleavage does not occur in Drosophila embryos that are unable to activate the apoptotic cascade. Importantly, dying cells can be recognized in live embryos, thus opening the way for in vivo imaging. As expected from the high conservation of caspases, it is also cleaved in dying cells of chick embryos. It is therefore likely to be generally useful to track the spatiotemporal pattern of caspase activity in a variety of species.


Conflict of interest statement

The authors declare no conflict of interest.

Figures

Fig. 1.
Fig. 1.
Structure and cleavage of Apoliner. (A) Schematic representation of Apoliner. Numbers indicate position of residues. The cleavage site is marked with an asterisk (see Materials and Methods). (B, C ) Western blots showing Drice, Apoliner, and Apomut at various times following induction of reaper expression in S2 cells. Numbers indicate time in minutes; and minus signs indicate uninduced cells. Apoptosis was induced 48 h after transfection of a vector expressing either Apoliner or Apomut. n.t., no transfection. (B Upper) Western blot stained with antiGFP to detect uncleaved (full length) Apoliner extracted from cells transfected with Apoliner or Apomut. This band has essentially disappeared at 60 min, indicating Apoliner cleavage. (B Lower) As full length Apoliner disappears, a cleavage product, detected with anti-DIAP1 increases. This fragment should also be detectable by anti-GFP, but this is unfortunately masked by a protein of similar size recognized nonspecifically by the anti-GFP antibody (data not shown). Note the absence of any cleavage product in extracts from cells expressing Apomut, a strong indication that Apoliner cleavage depends on the integrity of the caspase cleavage site. Note also that Drice cleavage (appearance of the P17 Drice fragment in C) only begins to be faintly detectable 60 min after induction, a time when full length Apoliner is completely cleaved (as shown in B Upper). (D–F) S2 cells transfected with Apoliner (D, E ) or Apomut (F ), and induced to die by a 10-min ultraviolet exposure. Before induction, RFP (magenta) and GFP (green) colocalize at membranes (giving a white signal in the merge) in a majority of cells (D). After induction, GFP relocalizes to the nucleus of most cells (E; see Fig. S1 for details). Even 180 min after apoptosis induction, cleavage of Apomut could not be detected as indicated by the colocalization of GFP and RFP (F ).
Fig. 2.
Fig. 2.
Apoliner cleavage as seen in the embryonic dMP2 neurons. Ventral nerve cord of a stage 17 Drosophila embryo expressing Apoliner under the control of dMP2-Gal4 (projection of two consecutive confocal slices). RFP (B), GFP (C ) and anti–cleaved caspase 3 (D) are shown independently and in an overlay (A). Apoliner cleavage is restricted to the pairs of neurons in the segments anterior to A6, as expected from the previously reported pattern of apoptosis in these cells (5). Both dying (white arrow and arrowhead) and surviving cells (empty arrow) can be recognized. The caspase-positive cells that are not dMP2 neurons (i.e., not expressing Apoliner) should of course be ignored. (Scale bar, 10 μm.)
Fig. 3.
Fig. 3.
Apoliner reports on caspase activity in vivo. Frames from a time-lapse movie tracking an Apoliner-positive cell in a live embryo (see Movie S1). Times are indicated in minutes. Caspase activity is detected by the presence of GFP in the nucleus and the red membrane. One Apoliner-positive cell is marked with an arrow in A–E. In A, this cell appears morphologically normal, although Apoliner is already cleaved. Later, it shrinks (C and D), before being taken up by hemocytes (D and E), and removed from the epithelium. In F, the arrow points to the original position of the removed cell. The arrowhead in D and E points to the hemocyte that engulfed this particular dying epidermal cell.
Fig. 4.
Fig. 4.
Comparing Apoliner and TUNEL in normal and apoptosis-deficient Drosophila embryos. (A–C) TUNEL and Apoliner in a control (+/+ or H99/+) embryo. (A) TUNEL signal as seen in a lateral view (projection of 16 consecutive confocal slices). (B) Apoliner in the embryo shown in A, with RFP displayed in magenta and GFP in green, resulting in a white signal upon colocalization. Again, 16 confocal slices are shown, but this time they are projected using the 3D function of Volocity (Improvision). (C) High-magnification view of one confocal slice from B, showing RFP, GFP, and TUNEL, and the overlay on the left-hand side. The arrow points to a shrunken Apoliner-positive cell, which is also positive for TUNEL, an indication of advanced apoptosis. At this late stage, the GFP signal is no longer detectable, presumably because of the high proteolytic activity in this cell (see Fig. S1). (D) TUNEL staining in a wild-type (or H99/+) embryo that does not express Apoliner. Note that the number of TUNEL-positive nuclei is approximately the same as in A, indicating that Apoliner does not interfere significantly with developmental apoptosis. (E–G) TUNEL and Apoliner in a H99-deficient embryo. (E) H99-deficient embryo stained for TUNEL; very little staining can be detected. (F) Apoliner in the embryos shown in E, with RFP in magenta and GFP in green (again, 16 confocal slices projected using the 3D function in Volocity–Improvision). (G) High-magnification view of one confocal slice from F (H99-deficient embryo). In the trunk epidermis, no TUNEL signal or Apoliner cleavage can be detected, whereas an occasional signal is observed in the head region (data not shown; also see ref. 8). [Scale bar for A, D, and E (shown in A), 50 μm; scale bar for B and F (shown in B), 10 μm.]
Fig. 5.
Fig. 5.
Apoliner cleavage in the chick spinal cord correlates with increased apoptosis. Each presents a single confocal slice of a chick spinal cord electroporated with either Apoliner alone (A, B), or Apoliner and AP2α (C, D). The spinal cords were fixed either 6–7 h (A, C) or 16–17 h (B, D) after electroporation. Samples were stained with anti–cleaved caspase 3. When only Apoliner is electroporated, few cells are immunoreactive, as shown in B, 16–17 h after electroporation. As expected, both the red and green fluorophores are at the membrane of Apoliner-expressing cells (shown in A, arrow, 6–7 h after electroporation). Relatively few red-only corpses can be seen (outlined arrowhead). These probably reflect the low-level apoptosis that occurs in these samples. By contrast, extensive apoptosis is seen after AP2α expression. This is clearly seen by anti–cleaved caspase 3 staining 16–17 h after electroporation (D) but not yet detectable with the same method 6–7 h postelectroporation (data not shown). In similarly treated spinal cords, as early as 6 h after electroporation, GFP and RFP are seen in distinct subcellular compartment more frequently than in controls (C, arrow). As can be seen, the GFP fills a large fraction of the cell body, consistent with nuclear localization, because the nucleus occupies most of the cell body in these neurons at this stage (see ref. for example).

References

    1. Domingos PM, Steller H. Pathways regulating apoptosis during patterning and development. Curr Opin Genet Dev. 2007;17:294–299. - PMC - PubMed
    1. Cashio P, Lee TV, Bergmann A. Genetic control of programmed cell death in Drosophila melanogaster. Semin Cell Dev Biol. 2005;16:225–235. - PubMed
    1. Wang SL, et al. The Drosophila caspase inhibitor DIAP1 is essential for cell survival and is negatively regulated by HID. Cell. 1999;98:453–463. - PubMed
    1. Ditzel M, et al. Degradation of DIAP1 by the N-end rule pathway is essential for regulating apoptosis. Nat Cell Biol. 2003;5:467–473. - PubMed
    1. Miguel-Aliaga I, Thor S. Segment-specific prevention of pioneer neuron apoptosis by cell-autonomous, postmitotic Hox gene activity. Development. 2004;131:6093–6105. - PubMed

Publication types

LinkOut - more resources