

Comparison of the 2005 growth charts for Saudi children and adolescents to the 2000 CDC growth charts
- PMID: 18779639
- PMCID: PMC6074495
- DOI: 10.5144/0256-4947.2008.334
Comparison of the 2005 growth charts for Saudi children and adolescents to the 2000 CDC growth charts
Erratum in
- Ann Saudi Med. 2008 Nov-Dec;28(6):474
Abstract
Background and objectives: The 2000 CDC growth charts for the United States, a revision of the National Center for Health Statistics/World Health Organization (NCHS/WHO) growth charts, were released in 2002 to replace the NCHS/WHO charts. We evaluated the differences between the CDC growth charts and the Saudi 2005 reference to determine the implications of using the 2000 CDC growth charts in Saudi children and adolescents.
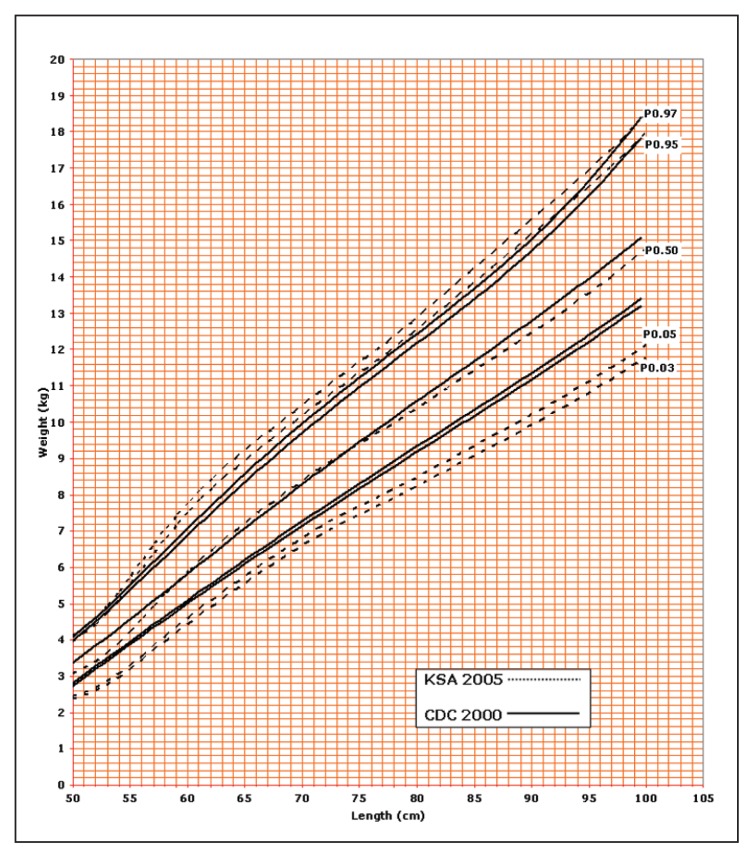
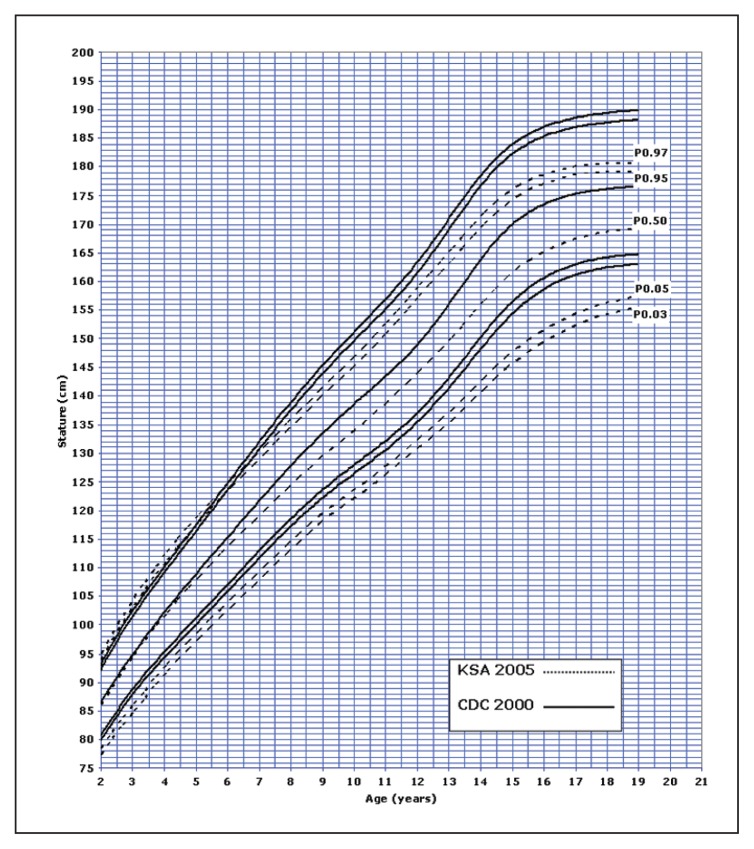
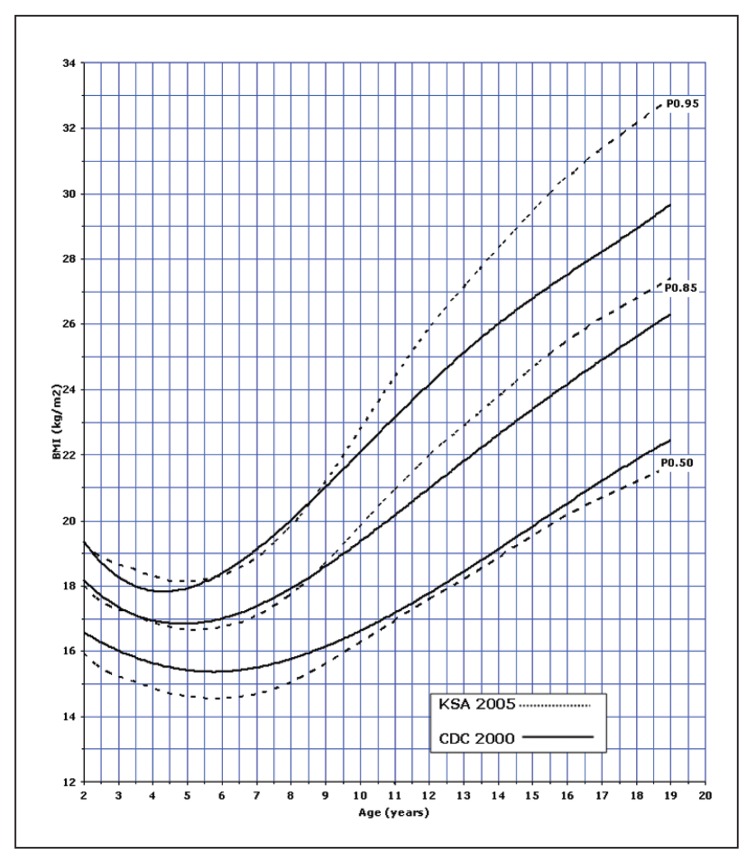
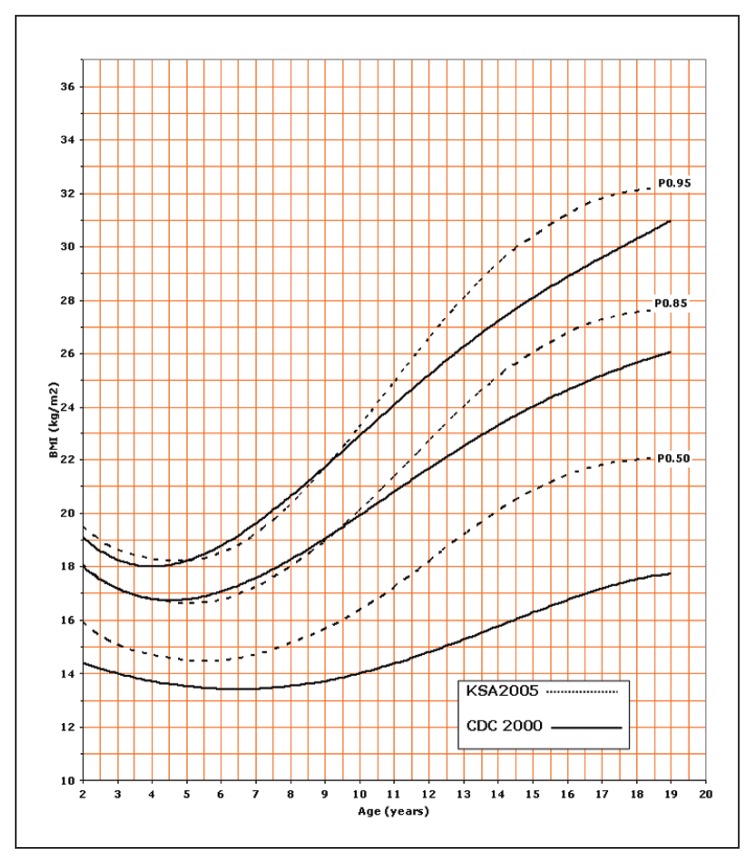
Subjects and methods: The Saudi reference was based on a cross-sectional representative sample of the Saudi population of healthy children and adolescents from birth to 19 years of age. Measurements of the length/stature, weight and head circumference were performed according to expert recommendations. The CDC charts from birth to 20 years were based on a cross-sectional representative national sample from five sources collected between 1963 and 1994. The data from the CDC study including the 3rd, 5th, 50th, 95th, and 97th percentiles were plotted against the corresponding percentiles on the Saudi charts for the weight for age, height for age, weight for height for children from 0 to 36 months and weight for age, stature for age and body mass index for children 2 to 19 years of age.
Results: There were major differences between the two growth charts. The main findings were the upward shift of the lower percentiles of the CDC curves and the overlap or downward shift of the upper percentiles, especially for weight, weight for height, and BMI.
Conclusion: The use of the 2000 CDC growth charts for Saudi children and adolescents increases the prevalence of undernutrition, stunting, and wasting, potentially leading to unnecessary referrals, investigations and parental anxiety. The increased prevalence of overweight and obesity is alarming and needs further investigation.
Figures


Similar articles
-
Body mass index in Saudi Arabian children and adolescents: a national reference and comparison with international standards.Ann Saudi Med. 2009 Sep-Oct;29(5):342-7. doi: 10.4103/0256-4947.55162. Ann Saudi Med. 2009. PMID: 19700890 Free PMC article.
-
Comparison of the prevalence of shortness, underweight, and overweight among US children aged 0 to 59 months by using the CDC 2000 and the WHO 2006 growth charts.J Pediatr. 2008 Nov;153(5):622-8. doi: 10.1016/j.jpeds.2008.05.048. Epub 2008 Jul 10. J Pediatr. 2008. PMID: 18619613
-
Growth reference for Saudi preschool children: LMS parameters and percentiles.Ann Saudi Med. 2016 Jan-Feb;36(1):2-6. doi: 10.5144/0256-4947.2016.2. Ann Saudi Med. 2016. PMID: 26922681 Free PMC article.
-
[WHO growth standards for infants and young children].Arch Pediatr. 2009 Jan;16(1):47-53. doi: 10.1016/j.arcped.2008.10.010. Epub 2008 Nov 25. Arch Pediatr. 2009. PMID: 19036567 Review. French.
-
Accuracy of international growth charts to assess nutritional status in children and adolescents: a systematic review.Rev Paul Pediatr. 2022 Apr 4;40:e2021016. doi: 10.1590/1984-0462/2022/40/2021016. eCollection 2022. Rev Paul Pediatr. 2022. PMID: 35442268 Free PMC article.
Cited by
-
The LMS and Z scale growth reference for Saudi school-age children and adolescents.Saudi J Gastroenterol. 2016 Jul-Aug;22(4):331-6. doi: 10.4103/1319-3767.187608. Saudi J Gastroenterol. 2016. PMID: 27488329 Free PMC article.
-
The associations of religiosity and family atmosphere with lifestyle among Saudi adolescents.SSM Popul Health. 2021 Mar 17;14:100766. doi: 10.1016/j.ssmph.2021.100766. eCollection 2021 Jun. SSM Popul Health. 2021. PMID: 33816747 Free PMC article.
-
Growth of the skull in young children in Baotou, China.Childs Nerv Syst. 2014 Sep;30(9):1511-5. doi: 10.1007/s00381-014-2468-6. Epub 2014 Jun 29. Childs Nerv Syst. 2014. PMID: 24974085
-
Sugar-sweetened carbonated beverage consumption correlates with BMI, waist circumference, and poor dietary choices in school children.BMC Public Health. 2010 May 9;10:234. doi: 10.1186/1471-2458-10-234. BMC Public Health. 2010. PMID: 20459689 Free PMC article.
-
Neonatal Birthweight Spectrum: Maternal Risk Factors and Pregnancy Outcomes in Saudi Arabia.Medicina (Kaunas). 2024 Jan 23;60(2):193. doi: 10.3390/medicina60020193. Medicina (Kaunas). 2024. PMID: 38399481 Free PMC article.
References
-
- Hamill PVV, Drizd TA, Johnson CL, Reed RB, Roche AF, Moore WM. Physical growth: National Center for Health Statistics percentiles. The Am J of Clin Nutr. 1979;32:607–629. - PubMed
-
- Euro-Growth references for length, weight, and body conferences. Euro-Growth Study Group. Huschke F, Van’t Hof ME, editors. J Pediatr Gastroenterol Nutr. 2000;31(Suppl 1):S14–S38. - PubMed
-
- World Health Organization. A growth chart for international use in maternal and child health care: guidelines for primary health care personnel. Geneva: World Health Organization; 1987.
-
- Al-Amoud M, Al-Mazrou Y, Khoja T, Al-Torki K, Tantawi NE. National Study of Growth Monitoring for 0–5 years Saudi Children. Ministry of Health; Riyadh, Kingdom of Saudi Arabia: 2001.
Publication types
MeSH terms
LinkOut - more resources
Full Text Sources
Medical