

Vaccination against GIP for the treatment of obesity
- PMID: 18779862
- PMCID: PMC2525840
- DOI: 10.1371/journal.pone.0003163
Vaccination against GIP for the treatment of obesity
Abstract
Background: According to the WHO, more than 1 billion people worldwide are overweight and at risk of developing chronic illnesses, including cardiovascular disease, type 2 diabetes, hypertension and stroke. Current therapies show limited efficacy and are often associated with unpleasant side-effect profiles, hence there is a medical need for new therapeutic interventions in the field of obesity. Gastric inhibitory peptide (GIP, also known as glucose-dependent insulinotropic polypeptide) has recently been postulated to link over-nutrition with obesity. In fact GIP receptor-deficient mice (GIPR(-/-)) were shown to be completely protected from diet-induced obesity. Thus, disrupting GIP signaling represents a promising novel therapeutic strategy for the treatment of obesity.
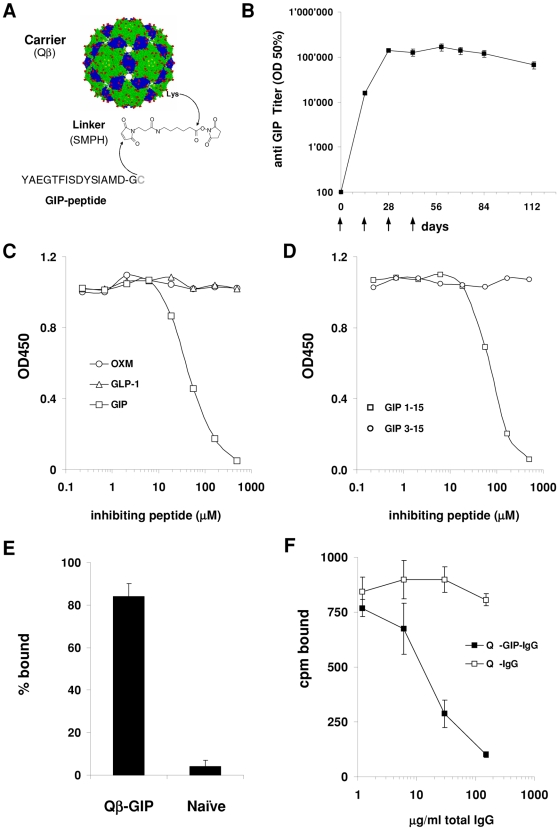
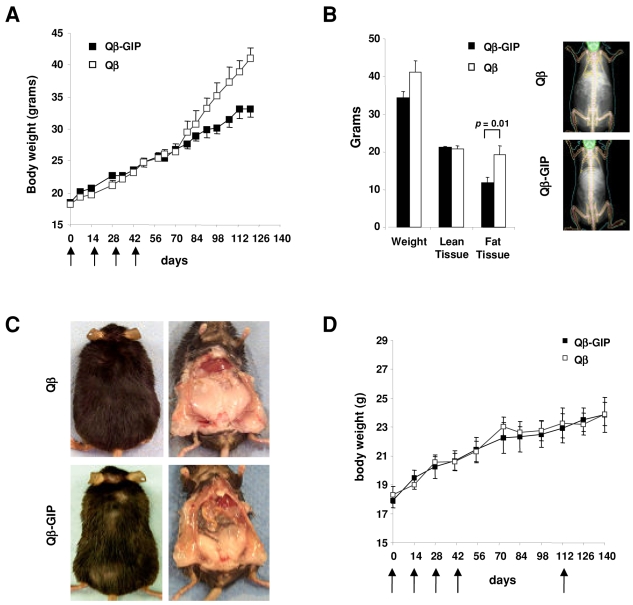
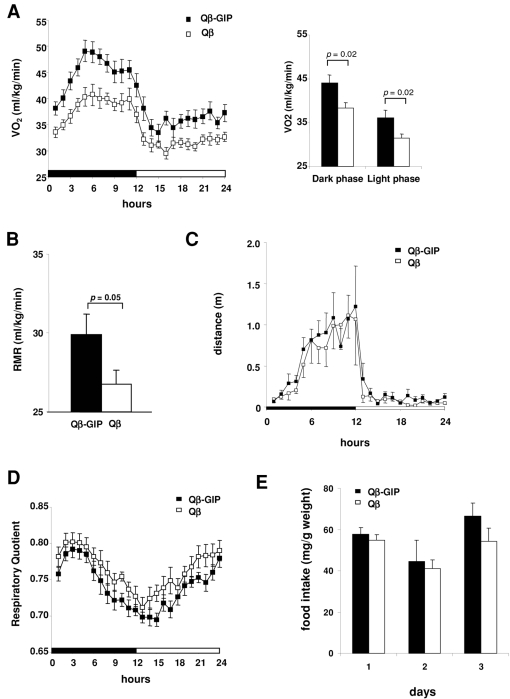
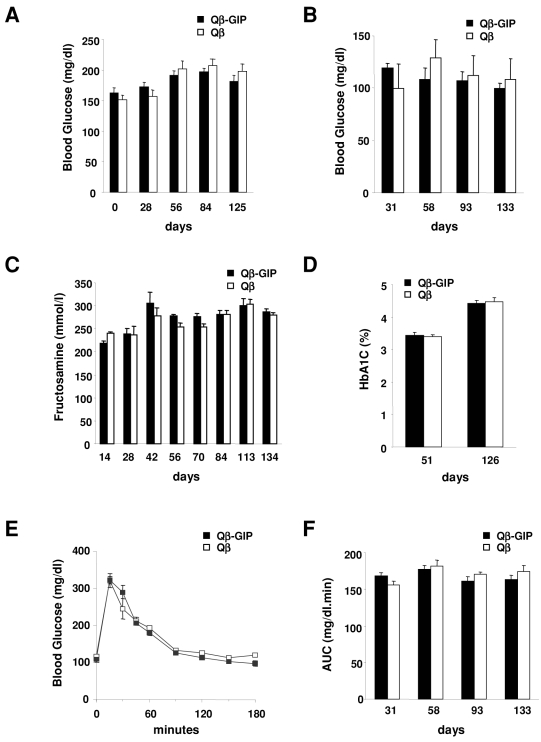
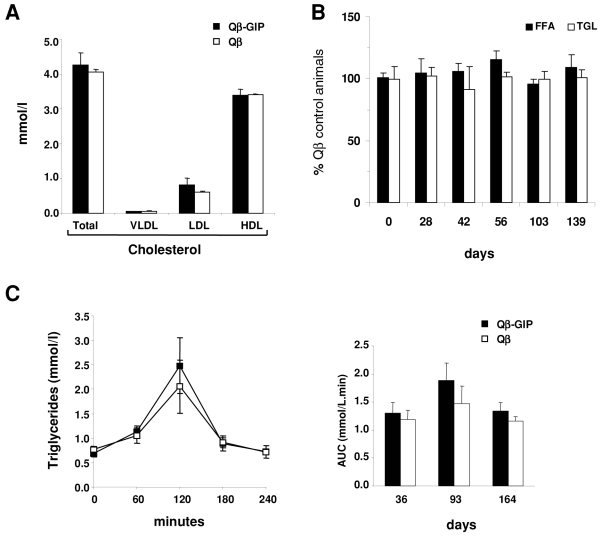
Methodology/principal findings: In order to block GIP signaling we chose an active vaccination approach using GIP peptides covalently attached to virus-like particles (VLP-GIP). Vaccination of mice with VLP-GIP induced high titers of specific antibodies and efficiently reduced body weight gain in animals fed a high fat diet. The reduction in body weight gain could be attributed to reduced accumulation of fat. Moreover, increased weight loss was observed in obese mice vaccinated with VLP-GIP. Importantly, despite the incretin action of GIP, VLP-GIP-treated mice did not show signs of glucose intolerance.
Conclusions/significance: This study shows that vaccination against GIP was safe and effective. Thus active vaccination may represent a novel, long-lasting treatment for obesity. However further preclinical safety/toxicology studies will be required before the therapeutic concept can be addressed in humans.
Conflict of interest statement
Figures
Similar articles
-
Attenuated secretion of glucose-dependent insulinotropic polypeptide (GIP) does not alleviate hyperphagic obesity and insulin resistance in ob/ob mice.Mol Metab. 2017 Jan 19;6(3):288-294. doi: 10.1016/j.molmet.2017.01.006. eCollection 2017 Mar. Mol Metab. 2017. PMID: 28271035 Free PMC article.
-
The glucose-dependent insulinotropic polypeptide (GIP) regulates body weight and food intake via CNS-GIPR signaling.Cell Metab. 2021 Apr 6;33(4):833-844.e5. doi: 10.1016/j.cmet.2021.01.015. Epub 2021 Feb 10. Cell Metab. 2021. PMID: 33571454 Free PMC article.
-
Glucose-dependent insulinotropic polypeptide receptor antagonist treatment causes a reduction in weight gain in ovariectomised high fat diet-fed mice.Br J Pharmacol. 2022 Sep;179(18):4486-4499. doi: 10.1111/bph.15894. Epub 2022 Jul 6. Br J Pharmacol. 2022. PMID: 35710141 Free PMC article.
-
The influence of Glucose-dependent Insulinotropic Polypeptide (GIP) on human adipose tissue and fat metabolism: Implications for obesity, type 2 diabetes and Non-Alcoholic Fatty Liver Disease (NAFLD).Peptides. 2020 Mar;125:170208. doi: 10.1016/j.peptides.2019.170208. Epub 2019 Nov 20. Peptides. 2020. PMID: 31759125 Review.
-
Blockade of gastric inhibitory polypeptide (GIP) action as a novel means of countering insulin resistance in the treatment of obesity-diabetes.Peptides. 2020 Mar;125:170203. doi: 10.1016/j.peptides.2019.170203. Epub 2019 Nov 13. Peptides. 2020. PMID: 31733230 Review.
Cited by
-
The pathogenic role of the GIP/GIPR axis in human endocrine tumors: emerging clinical mechanisms beyond diabetes.Rev Endocr Metab Disord. 2020 Mar;21(1):165-183. doi: 10.1007/s11154-019-09536-6. Rev Endocr Metab Disord. 2020. PMID: 31933128 Review.
-
Versatile virus-like particle carrier for epitope based vaccines.PLoS One. 2010 Mar 23;5(3):e9809. doi: 10.1371/journal.pone.0009809. PLoS One. 2010. PMID: 20352110 Free PMC article.
-
A compendium of G-protein-coupled receptors and cyclic nucleotide regulation of adipose tissue metabolism and energy expenditure.Clin Sci (Lond). 2020 Mar 13;134(5):473-512. doi: 10.1042/CS20190579. Clin Sci (Lond). 2020. PMID: 32149342 Free PMC article. Review.
-
Attenuated secretion of glucose-dependent insulinotropic polypeptide (GIP) does not alleviate hyperphagic obesity and insulin resistance in ob/ob mice.Mol Metab. 2017 Jan 19;6(3):288-294. doi: 10.1016/j.molmet.2017.01.006. eCollection 2017 Mar. Mol Metab. 2017. PMID: 28271035 Free PMC article.
-
Lifestyle Vaccines and Public Health: Exploring Policy Options for a Vaccine to Stop Smoking.Public Health Ethics. 2016 Jul;9(2):183-197. doi: 10.1093/phe/phw004. Epub 2016 Mar 14. Public Health Ethics. 2016. PMID: 27551304 Free PMC article.
References
-
- Kopelman PG. Obesity as a medical problem. Nature. 2000;404:635–643. - PubMed
-
- Blackburn G. Effect of degree of weight loss on health benefits. Obes Res. 1995;3(Suppl 2):211s–216s. - PubMed
-
- Bosello O, Armellini F, Zamboni M, Fitchet M. The benefits of modest weight loss in type II diabetes. Int J Obes Relat Metab Disord. 1997;21(Suppl 1):S10–13. - PubMed
-
- Goldstein DJ. Beneficial health effects of modest weight loss. Int J Obes Relat Metab Disord. 1992;16:397–415. - PubMed
-
- Greenway FL, Caruso MK. Safety of obesity drugs. Expert Opin Drug Saf. 2005;4:1083–1095. - PubMed
Publication types
MeSH terms
Substances
LinkOut - more resources
Full Text Sources
Other Literature Sources
Medical
