

Gene therapy for diabetes: metabolic effects of helper-dependent adenoviral exendin 4 expression in a diet-induced obesity mouse model
- PMID: 18781141
- PMCID: PMC2582376
- DOI: 10.1038/mt.2008.198
Gene therapy for diabetes: metabolic effects of helper-dependent adenoviral exendin 4 expression in a diet-induced obesity mouse model
Erratum in
-
Corrigendum to "Gene Therapy for Diabetes: Metabolic Effects of Helper-dependent Adenoviral Exendin 4 Expression in a Diet-induced Obesity Mouse Model".Mol Ther. 2009 Oct;17(10):1831. doi: 10.1038/mt.2009.137. Epub 2016 Dec 9. Mol Ther. 2009. PMID: 28160915 Free PMC article. No abstract available.
Abstract
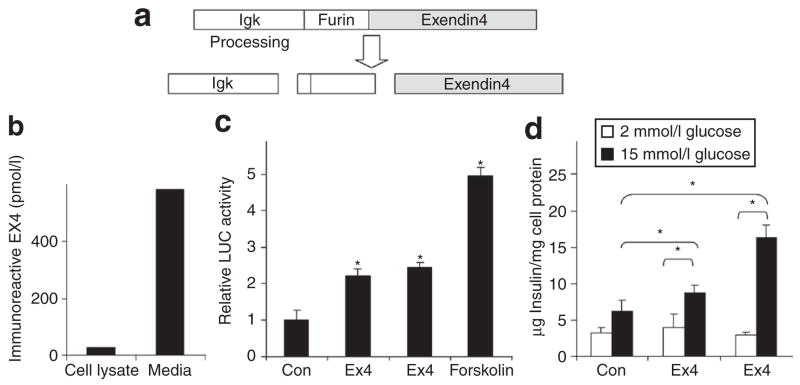
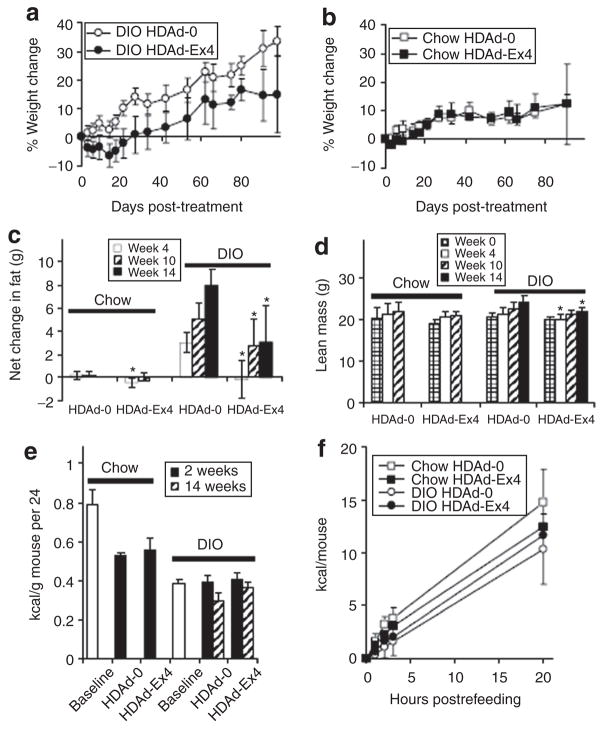
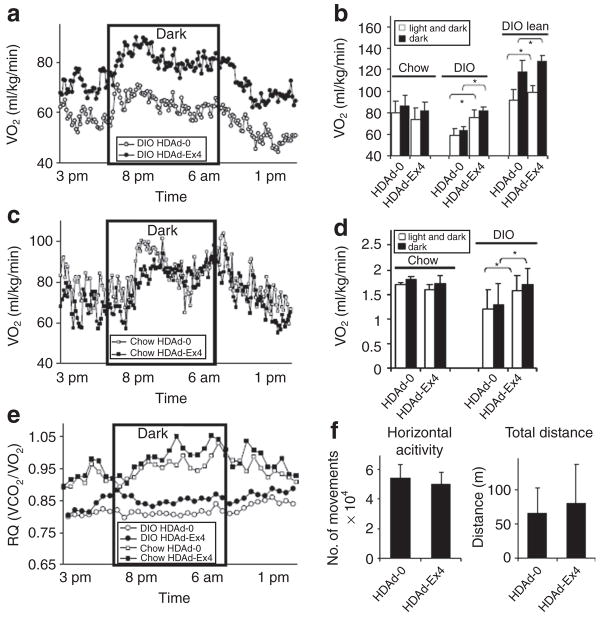
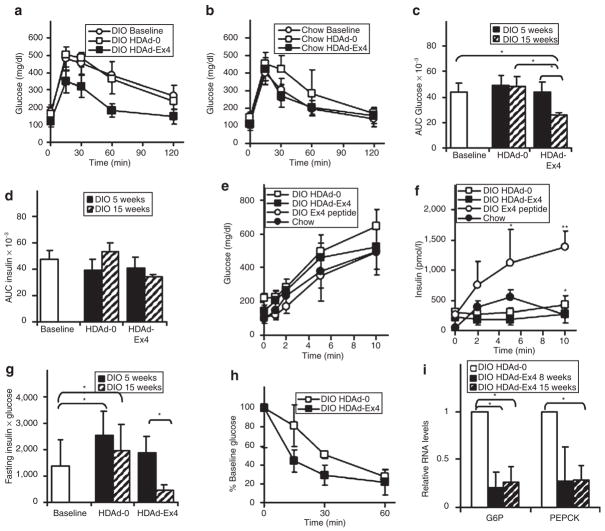
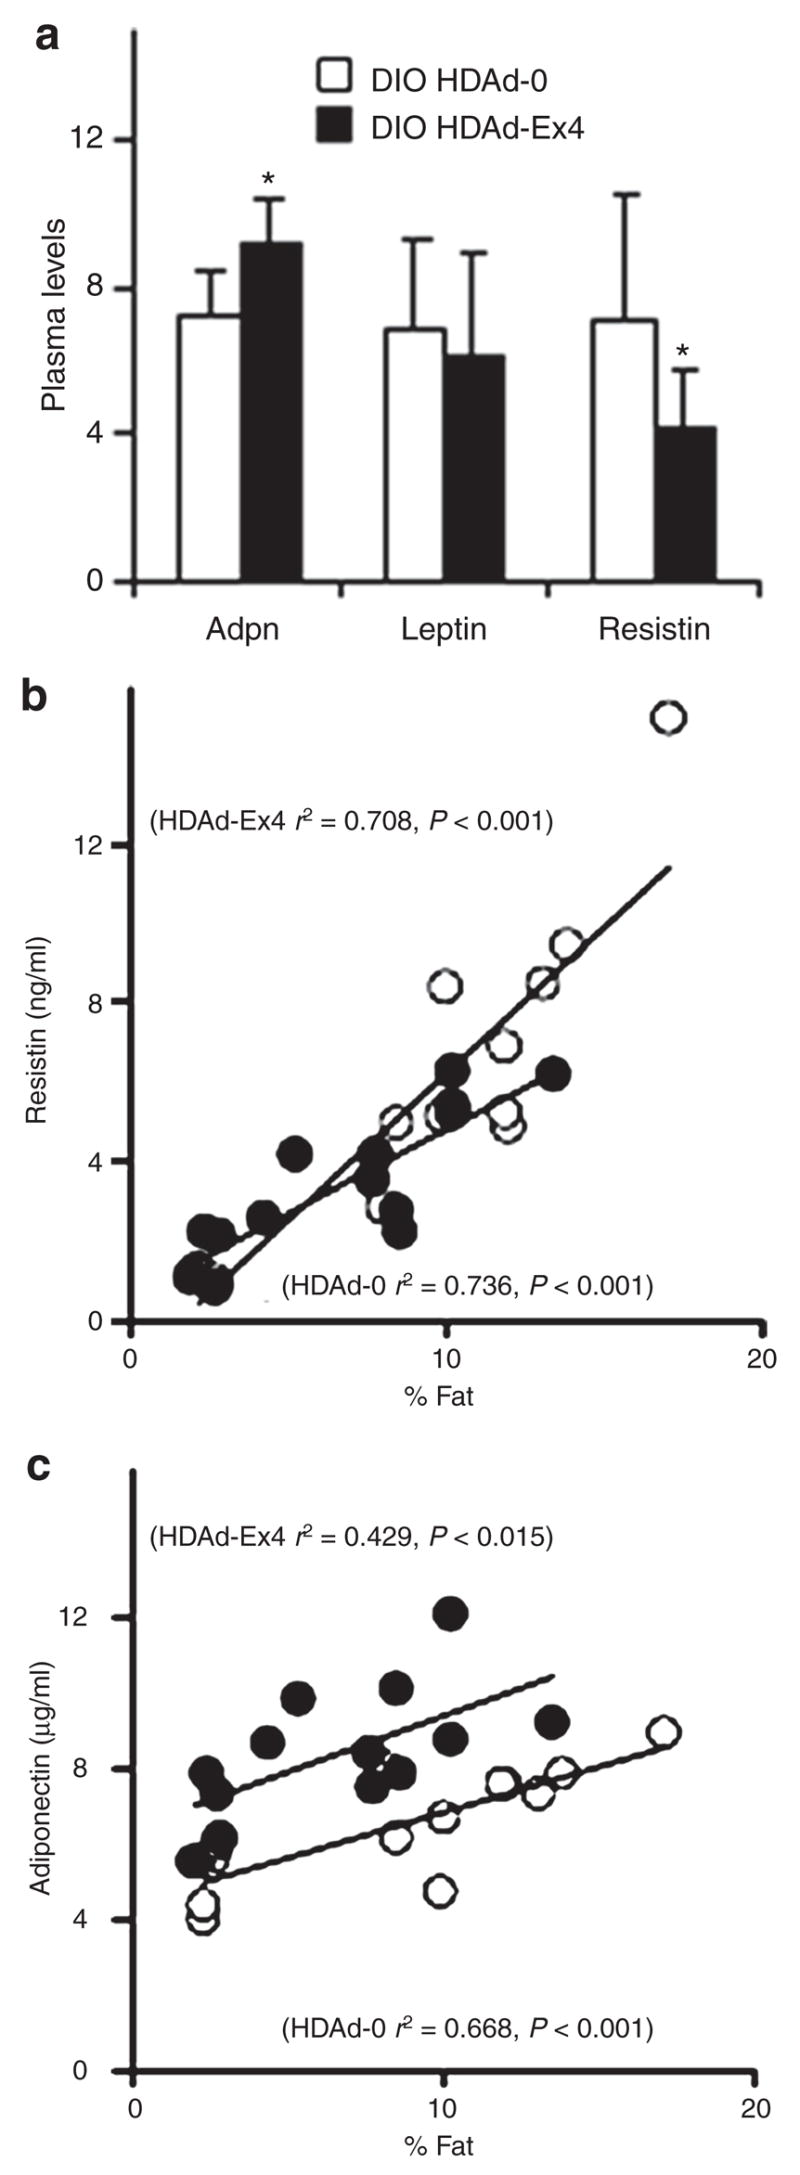
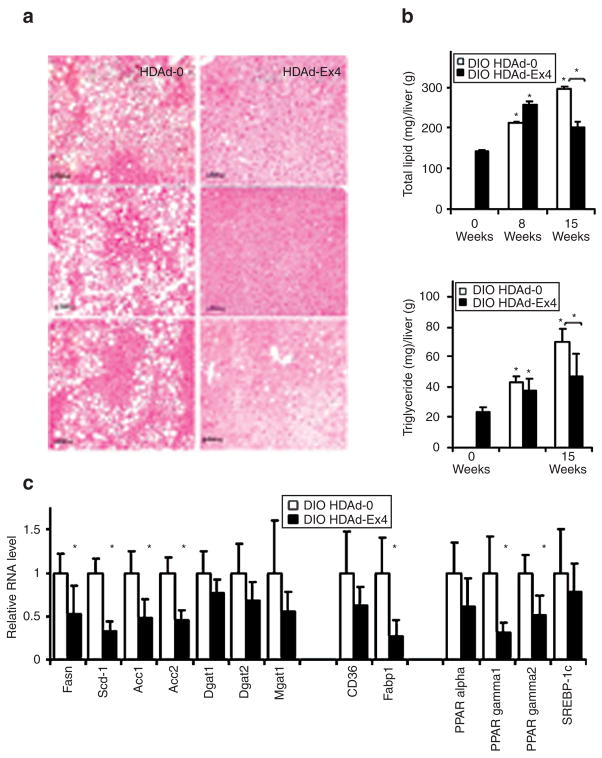
Exendin 4 (Ex4) is a glucagon-like peptide-1 receptor (GLP- 1R) agonist which is available as a short-acting injectable treatment for type 2 diabetes. Our aim was to characterize the long-term effects of elevated steady-state levels of Ex4 provided by in vivo gene therapy. We constructed a helper-dependent adenoviral (HDAd) vector for long-term expression of Ex4 in vivo. A high-fat diet (HFD)-induced obesity (DIO) mouse model was chosen to approximate the metabolic derangements seen in obese patients. Mice were treated with a single injection of HDAd-Ex4 and were monitored for 15 weeks. Both hepatic Ex4 RNA and plasma Ex4 were detectable at the end of the study. HDAd-Ex4 treatment improved glucose homeostasis without increasing insulin levels. However, there was evidence of enhanced insulin action and decreased gluconeogenic enzyme expression. HDAd-Ex4 caused decreased weight gain without detectable changes in food intake, in part, due to increases in energy expenditure (EE). HDAd-Ex4 DIO mice also had reduced hepatic fat and an improved adipokine profile. In the liver, there was decreased expression of genes that were involved in de novo fatty acid synthesis. These observations are important in considering the development of longer acting GLP-1R agonists for the treatment of type 2 diabetes.
Figures
Similar articles
-
Sustained exendin-4 secretion through gene therapy targeting salivary glands in two different rodent models of obesity/type 2 diabetes.PLoS One. 2012;7(7):e40074. doi: 10.1371/journal.pone.0040074. Epub 2012 Jul 13. PLoS One. 2012. PMID: 22808093 Free PMC article.
-
High-fat diet changes the temporal profile of GLP-1 receptor-mediated hypophagia in rats.Am J Physiol Regul Integr Comp Physiol. 2013 Jul 1;305(1):R68-77. doi: 10.1152/ajpregu.00588.2012. Epub 2013 Apr 24. Am J Physiol Regul Integr Comp Physiol. 2013. PMID: 23616105 Free PMC article.
-
Oleoylethanolamide modulates glucagon-like peptide-1 receptor agonist signaling and enhances exendin-4-mediated weight loss in obese mice.Am J Physiol Regul Integr Comp Physiol. 2018 Oct 1;315(4):R595-R608. doi: 10.1152/ajpregu.00459.2017. Epub 2018 Jun 27. Am J Physiol Regul Integr Comp Physiol. 2018. PMID: 29949410 Free PMC article.
-
The value of short- and long-acting glucagon-like peptide-1 agonists in the management of type 2 diabetes mellitus: experience with exenatide.Curr Med Res Opin. 2016;32(1):61-76. doi: 10.1185/03007995.2015.1103214. Epub 2015 Nov 11. Curr Med Res Opin. 2016. PMID: 26439329 Review.
-
Gene therapy with helper-dependent adenoviral vectors: lessons from studies in large animal models.Virus Genes. 2017 Oct;53(5):684-691. doi: 10.1007/s11262-017-1471-x. Epub 2017 Jun 7. Virus Genes. 2017. PMID: 28593513 Review.
Cited by
-
Glucagon-like peptide-1 gene therapy.Exp Diabetes Res. 2011;2011:601047. doi: 10.1155/2011/601047. Epub 2011 Jun 20. Exp Diabetes Res. 2011. PMID: 21747830 Free PMC article. Review.
-
Targeted in vivo gene integration of a secretion-enabled GLP-1 receptor agonist reverses diet-induced non-genetic obesity and pre-diabetes.Commun Med (Lond). 2025 Jul 9;5(1):269. doi: 10.1038/s43856-025-00959-8. Commun Med (Lond). 2025. PMID: 40634590 Free PMC article.
-
Exendin-4 improves blood glucose control in both young and aging normal non-diabetic mice, possible contribution of beta cell independent effects.PLoS One. 2011;6(5):e20443. doi: 10.1371/journal.pone.0020443. Epub 2011 May 31. PLoS One. 2011. PMID: 21655268 Free PMC article.
-
Exenatide decreases hepatic fibroblast growth factor 21 resistance in non-alcoholic fatty liver disease in a mouse model of obesity and in a randomised controlled trial.Diabetologia. 2011 Dec;54(12):3093-100. doi: 10.1007/s00125-011-2317-z. Epub 2011 Sep 29. Diabetologia. 2011. PMID: 21956711 Free PMC article. Clinical Trial.
-
Advances in Non-Viral DNA Vectors for Gene Therapy.Genes (Basel). 2017 Feb 10;8(2):65. doi: 10.3390/genes8020065. Genes (Basel). 2017. PMID: 28208635 Free PMC article.
References
-
- Holst JJ. The physiology of glucagon-like peptide 1. Physiol Rev. 2007;87:1409–1439. - PubMed
-
- Aja S, Ewing C, Lin J, Hyun J, Moran TH. Blockade of central GLP–1 receptors prevents CART–induced hypophagia and brain c–Fos expression. Peptides. 2006;27:157–164. - PubMed
-
- Schick RR, Zimmermann JP, Walde TV, Schusdziarra V. Peptides that regulate food intake – Glucagon–like peptide 1–(7–36) amide acts at lateral and medial hypothalamic sites to suppress feeding in rats. Am J Physiol Reg Integr and Comp Physiol. 2003;284:R1427–R1435. - PubMed
-
- Brubaker PL. Incretin–based therapies: mimetics versus protease inhibitors. Trends Endocrinol Metab. 2007;18:240–245. - PubMed
Publication types
MeSH terms
Substances
Grants and funding
LinkOut - more resources
Full Text Sources
Other Literature Sources
Medical
Molecular Biology Databases
