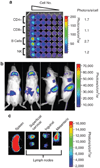
Assessing siRNA pharmacodynamics in a luciferase-expressing mouse
- PMID: 18781145
- PMCID: PMC3014086
- DOI: 10.1038/mt.2008.187
Assessing siRNA pharmacodynamics in a luciferase-expressing mouse
Abstract
A significant barrier to the successful general development of small-interfering RNA (siRNA) therapeutics is the ability to deliver them systemically to target organs and cell types. In this study, we have developed a mouse strain that will facilitate the evaluation of the efficacy of siRNA delivery strategies. This strain contains robust ubiquitous expression of firefly luciferase from germ line Cre-mediated recombination of the ROSA26-LSL-Luc allele. We show that luciferase is highly and uniformly expressed in all tissues examined. Using this mouse model, we describe a facile assay that enables the assessment of the pharmacodynamics of a systemically delivered siRNA formulation. These mice can also be used as universal donors, enabling the efficient and sensitive monitoring of cell trafficking or tissue transplantation. The primary advantage of this approach is that siRNA efficacy against a nonessential target can be easily evaluated in any tissue. This strain should generally enhance the ability to rapidly screen, compare and optimize various siRNA formulations for tissue-targeted or -enhanced systemic delivery in a preclinical development setting.
Figures


Similar articles
-
Lipid-mediated siRNA delivery down-regulates exogenous gene expression in the mouse brain at picomolar levels.J Gene Med. 2005 Feb;7(2):198-207. doi: 10.1002/jgm.659. J Gene Med. 2005. PMID: 15515135
-
Gene silencing in primary and metastatic tumors by small interfering RNA delivery in mice: quantitative analysis using melanoma cells expressing firefly and sea pansy luciferases.J Control Release. 2005 Jul 20;105(3):332-43. doi: 10.1016/j.jconrel.2005.04.012. J Control Release. 2005. PMID: 15936841
-
Usefulness of the luciferase reporter system to test the efficacy of siRNA.Methods Mol Biol. 2006;342:181-7. doi: 10.1385/1-59745-123-1:181. Methods Mol Biol. 2006. PMID: 16957375 Review.
-
R/L, a double reporter mouse line that expresses luciferase gene upon Cre-mediated excision, followed by inactivation of mRFP expression.Genome. 2016 Oct;59(10):816-826. doi: 10.1139/gen-2016-0090. Epub 2016 Jul 27. Genome. 2016. PMID: 27643679
-
Lipidation of polyethylenimine-based polyplex increases serum stability of bioengineered RNAi agents and offers more consistent tumoral gene knockdown in vivo.Int J Pharm. 2018 Aug 25;547(1-2):537-544. doi: 10.1016/j.ijpharm.2018.06.026. Epub 2018 Jun 9. Int J Pharm. 2018. PMID: 29894758 Free PMC article.
Cited by
-
Quantitative evaluation of siRNA delivery in vivo.RNA. 2010 Dec;16(12):2553-63. doi: 10.1261/rna.2255810. Epub 2010 Oct 12. RNA. 2010. PMID: 20940339 Free PMC article.
-
Development of a Positive-readout Mouse Model of siRNA Pharmacodynamics.Mol Ther Nucleic Acids. 2013 Nov 19;2(11):e133. doi: 10.1038/mtna.2013.63. Mol Ther Nucleic Acids. 2013. PMID: 24253258 Free PMC article.
-
Progress toward in vivo use of siRNAs-II.Mol Ther. 2012 Mar;20(3):483-512. doi: 10.1038/mt.2011.263. Epub 2011 Dec 20. Mol Ther. 2012. PMID: 22186795 Free PMC article. Review.
-
Low-Molecular-Weight Polyethyleneimine Grafted Polythiophene for Efficient siRNA Delivery.Biomed Res Int. 2015;2015:406389. doi: 10.1155/2015/406389. Epub 2015 Oct 11. Biomed Res Int. 2015. PMID: 26539490 Free PMC article.
-
Slow disease progression in a C57BL/6 pten-deficient mouse model of prostate cancer.Am J Pathol. 2011 Jul;179(1):502-12. doi: 10.1016/j.ajpath.2011.03.014. Epub 2011 May 7. Am J Pathol. 2011. PMID: 21703427 Free PMC article.
References
-
- Willmann JK, van Bruggen N, Dinkelborg LM, Gambhir SS. Molecular imaging in drug development. Nat Rev Drug Discov. 2008;7:591–607. - PubMed
-
- Contag CH, Spilman SD, Contag PR, Oshiro M, Eames B, Dennery P, et al. Visualizing gene expression in living mammals using a bioluminescent reporter. Photochem Photobiol. 1997;66:523–531. - PubMed
-
- Carlsen H, Moskaug JO, Fromm SH, Blomhoff R. In vivo imaging of NF-kappa B activity. J Immunol. 2002;168:1441–1446. - PubMed
Publication types
MeSH terms
Substances
Grants and funding
LinkOut - more resources
Full Text Sources
Other Literature Sources

