

New insights into central roles of cerebral oxygen metabolism in the resting and stimulus-evoked brain
- PMID: 18781163
- PMCID: PMC2613165
- DOI: 10.1038/jcbfm.2008.97
New insights into central roles of cerebral oxygen metabolism in the resting and stimulus-evoked brain
Abstract
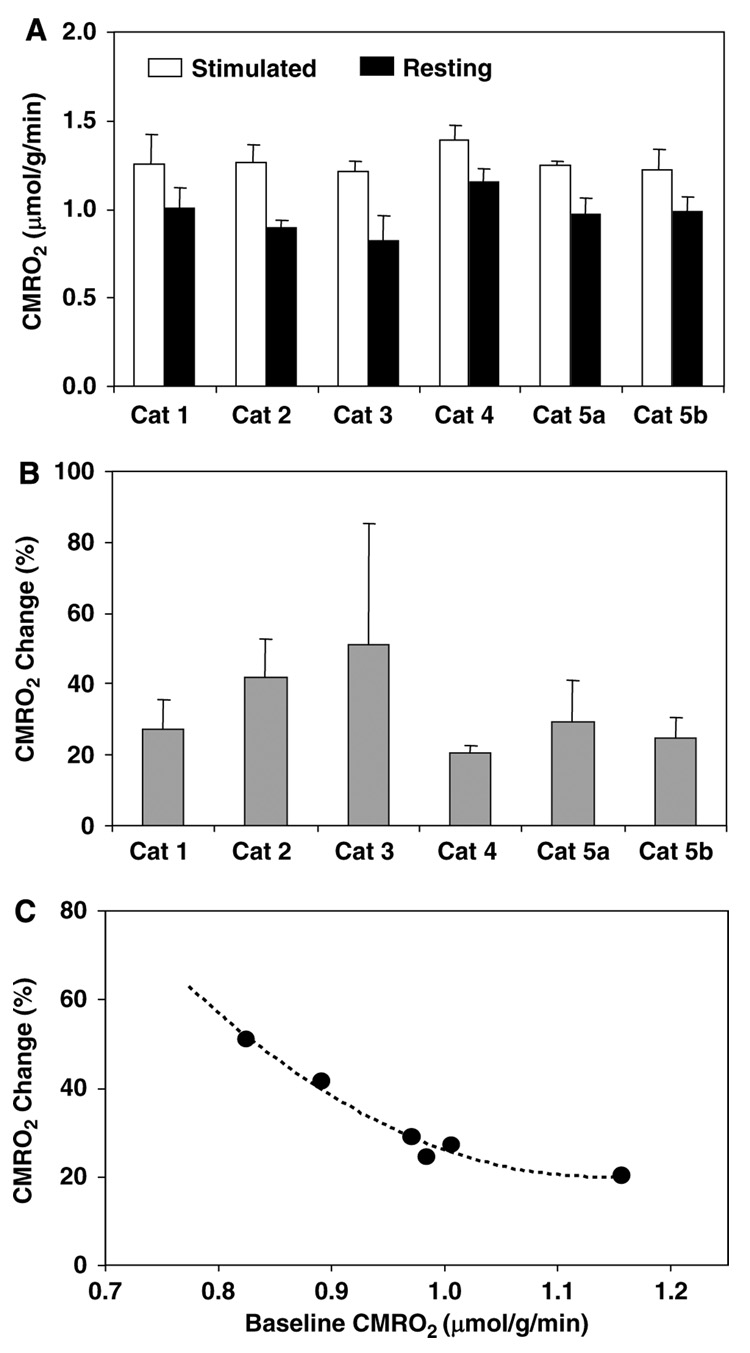
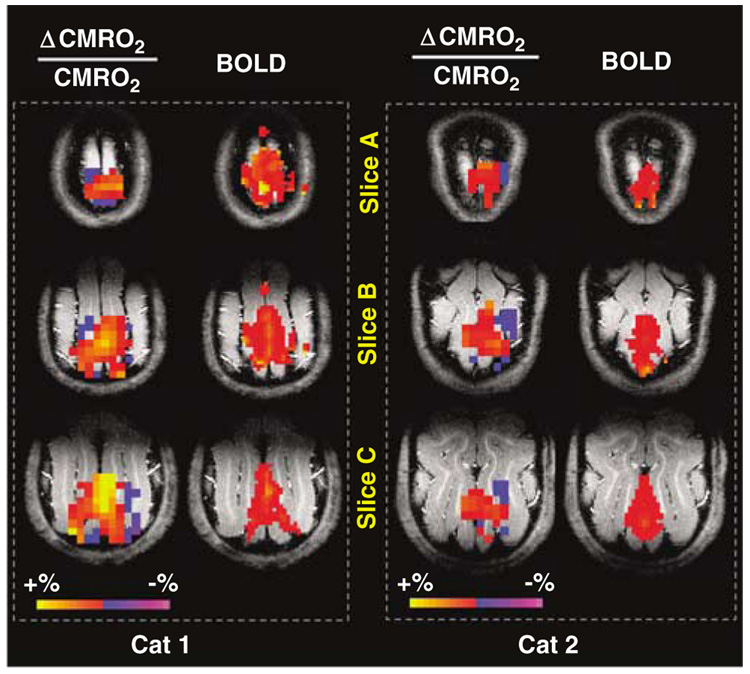
The possible role of oxygen metabolism in supporting brain activation remains elusive. We have used a newly developed neuroimaging approach based on high-field in vivo (17)O magnetic resonance spectroscopic (MRS) imaging to noninvasively image cerebral metabolic rate of oxygen (CMRO(2)) consumption in cats at rest and during visual stimulation. It was found that CMRO(2) increases significantly (32.3%+/-10.8%, n=6) in the activated visual cortical region as depicted in blood oxygenation level dependence functional maps; this increase is also accompanied by a CMRO(2) decrease in surrounding cortical regions, resulting a smaller increase (9.7%+/-1.9%) of total CMRO(2) change over a larger cortical region displaying either a positive or negative CMRO(2) alteration. Moreover, a negative correlation between stimulus-evoked percent CMRO(2) increase and resting CMRO(2) was observed, indicating an essential impact of resting brain metabolic activity level on stimulus-evoked percent CMRO(2) change and neuroimaging signals. These findings provide new insights into the critical roles of oxidative metabolism in supporting brain activation and function. They also suggest that in vivo (17)O MRS imaging should provide a sensitive neuroimaging modality for mapping CMRO(2) and its change induced by brain physiology and/or pathologic alteration.
Conflict of interest statement
The authors declare no competing financial interests.
Figures


Similar articles
-
Noninvasive and three-dimensional imaging of CMRO(2) in rats at 9.4 T: reproducibility test and normothermia/hypothermia comparison study.J Cereb Blood Flow Metab. 2007 Jun;27(6):1225-34. doi: 10.1038/sj.jcbfm.9600421. Epub 2006 Nov 29. J Cereb Blood Flow Metab. 2007. PMID: 17133228
-
Magnetic resonance imaging of resting OEF and CMRO₂ using a generalized calibration model for hypercapnia and hyperoxia.Neuroimage. 2012 Apr 2;60(2):1212-25. doi: 10.1016/j.neuroimage.2011.12.056. Epub 2011 Dec 29. Neuroimage. 2012. PMID: 22227047
-
Development of (17)O NMR approach for fast imaging of cerebral metabolic rate of oxygen in rat brain at high field.Proc Natl Acad Sci U S A. 2002 Oct 1;99(20):13194-9. doi: 10.1073/pnas.202471399. Epub 2002 Sep 19. Proc Natl Acad Sci U S A. 2002. PMID: 12242341 Free PMC article.
-
Quantitative imaging of brain energy metabolisms and neuroenergetics using in vivo X-nuclear 2H, 17O and 31P MRS at ultra-high field.J Magn Reson. 2018 Jul;292:155-170. doi: 10.1016/j.jmr.2018.05.005. J Magn Reson. 2018. PMID: 29866434 Free PMC article. Review.
-
Biophysical and physiological origins of blood oxygenation level-dependent fMRI signals.J Cereb Blood Flow Metab. 2012 Jul;32(7):1188-206. doi: 10.1038/jcbfm.2012.23. Epub 2012 Mar 7. J Cereb Blood Flow Metab. 2012. PMID: 22395207 Free PMC article. Review.
Cited by
-
Astrocytic energetics during excitatory neurotransmission: What are contributions of glutamate oxidation and glycolysis?Neurochem Int. 2013 Oct;63(4):244-58. doi: 10.1016/j.neuint.2013.06.015. Epub 2013 Jul 6. Neurochem Int. 2013. PMID: 23838211 Free PMC article. Review.
-
Simultaneous and noninvasive imaging of cerebral oxygen metabolic rate, blood flow and oxygen extraction fraction in stroke mice.Neuroimage. 2013 Jan 1;64:437-47. doi: 10.1016/j.neuroimage.2012.09.028. Epub 2012 Sep 18. Neuroimage. 2013. PMID: 23000789 Free PMC article.
-
Magnetic Resonance Water Tracer Imaging Using 17 O-Labeled Water.Invest Radiol. 2024 Jan 1;59(1):92-103. doi: 10.1097/RLI.0000000000001021. Epub 2023 Sep 15. Invest Radiol. 2024. PMID: 37707860 Free PMC article. Review.
-
Quantitative measurement of cerebral physiology using respiratory-calibrated MRI.Neuroimage. 2012 Mar;60(1):582-91. doi: 10.1016/j.neuroimage.2011.12.017. Epub 2011 Dec 22. Neuroimage. 2012. PMID: 22209811 Free PMC article.
-
Computational approaches for understanding energy metabolism.Wiley Interdiscip Rev Syst Biol Med. 2013 Nov-Dec;5(6):733-50. doi: 10.1002/wsbm.1238. Epub 2013 Jul 29. Wiley Interdiscip Rev Syst Biol Med. 2013. PMID: 23897661 Free PMC article. Review.
References
-
- Arai T, Nakao S, Mori K, Ishimori K, Morishima I, Miyazawa T, Fritz-Zieroth B. Cerebral oxygen utilization analyzed by the use of oxygen-17 and its nuclear magnetic resonance. Biochem Biophys Res Commun. 1990;169:153–158. - PubMed
-
- Attwell D, Laughlin SB. An energy budget for signaling in the grey matter of the brain. J Cereb Blood Flow Metab. 2001;21:1133–1145. - PubMed
-
- Bandettini PA, Wong EC, Hinks RS, Tikofsky RS, Hyde JS. Time course EPI of human brain function during task activation. Magn Reson Med. 1992;25:390–397. - PubMed
-
- Barinaga M. What makes brain neurons run? Science. 1997;276:196–198. - PubMed
-
- Biswal B, Yetkin FZ, Haughton VM, Hyde JS. Functional connectivity in the motor cortex of resting human brain using echo-planar MRI. Magn Reson Med. 1995;34:537–541. - PubMed
Publication types
MeSH terms
Substances
Grants and funding
LinkOut - more resources
Full Text Sources
Miscellaneous
