. 2009 Apr;58(4-5):765-98.
doi: 10.1007/s00285-008-0216-9. Epub 2008 Sep 10.

Multiscale modelling and nonlinear simulation of vascular tumour growth

Affiliations

Multiscale modelling and nonlinear simulation of vascular tumour growth

Paul Macklin et al. J Math Biol. 2009 Apr.

Abstract

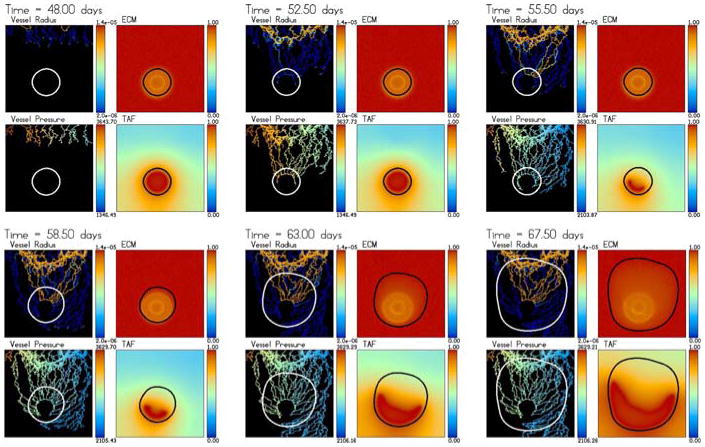
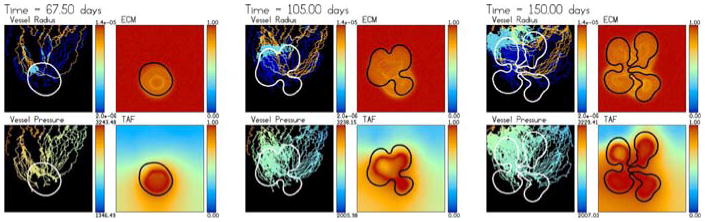
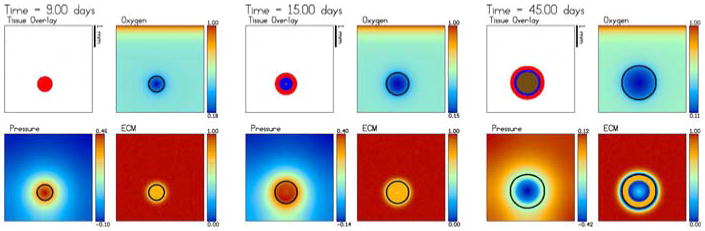
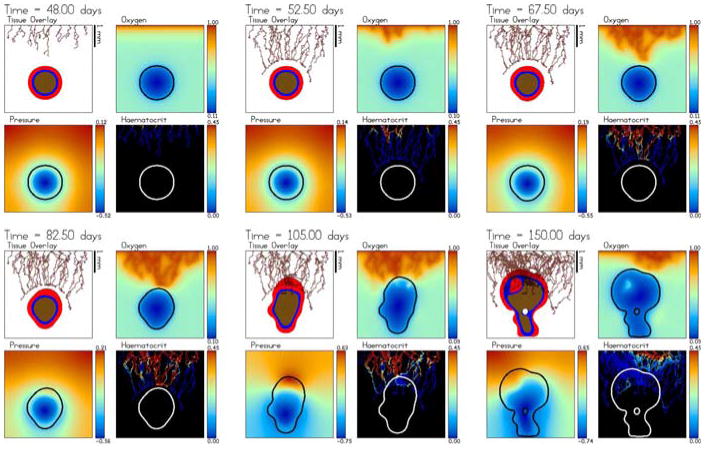
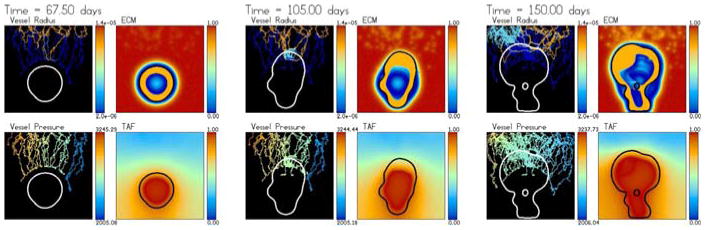
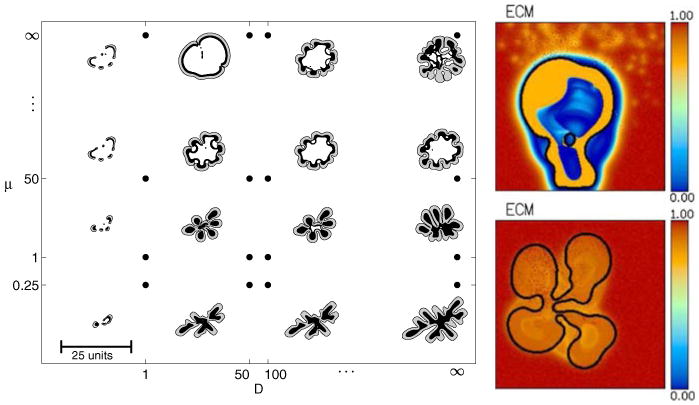
In this article, we present a new multiscale mathematical model for solid tumour growth which couples an improved model of tumour invasion with a model of tumour-induced angiogenesis. We perform nonlinear simulations of the multi-scale model that demonstrate the importance of the coupling between the development and remodeling of the vascular network, the blood flow through the network and the tumour progression. Consistent with clinical observations, the hydrostatic stress generated by tumour cell proliferation shuts down large portions of the vascular network dramatically affecting the flow, the subsequent network remodeling, the delivery of nutrients to the tumour and the subsequent tumour progression. In addition, extracellular matrix degradation by tumour cells is seen to have a dramatic affect on both the development of the vascular network and the growth response of the tumour. In particular, the newly developing vessels tend to encapsulate, rather than penetrate, the tumour and are thus less effective in delivering nutrients.


Figures

Fig. 1
Fig. 1
Schematic of the tumour regions. ΩP, ΩH and ΩN are the proliferating, quiescent/hypoxic and necrotic regions, respectively
Fig. 2
Fig. 2
The evolution towards a steady-state avascular multicell (2D) spheroid. The tumour regions (black proliferating ΩP, dark grey hypoxic/quiescent ΩH, light grey necrotic ΩN), the oxygen, mechanical pressure and ECM are shown at times t = 0, 15 and 45 days. An animation is available with the supplementary materials
Fig. 3
Fig. 3
The areas (mm2) of the total tumour (solid line), proliferating region (open circle), hypoxic region (closed dot) and the necrotic region (inverted triangle) as a function of time for the simulation in Fig. 2
Fig. 4
Fig. 4
Tumour-induced angiogenesis and vascular tumour growth. The vessels do not respond to the solid pressure generated by the growing tumour. The tumour develops a microvascular network that provides it with a direct source of oxygen and results in rapid growth with a compact (sphere-like) shape. The colour scheme is the same as in Fig. 2 and the times shown are t = 48 (3 days after angiogenesis is initiated), 52.5, 55.5, 58.5, 63 and 67.5 days. An animation can be found online with the supplementary materials
Fig. 5
Fig. 5
Dimensional intravascular radius (m) and pressure (Pa) along with the nondimensional ECM and TAF concentrations from the simulation shown in Fig. 4. The times are the same as in Fig. 4
Fig. 6
Fig. 6
The areas (mm2) of the total tumour (solid line), proliferating region (open circle), hypoxic region (closed dot) and the necrotic region (inverted triangle) as a function of time for the simulation in Fig. 4
Fig. 7
Fig. 7
Tumour-induced angiogenesis and vascular tumour growth. The vessels respond to the solid pressure generated by the growing tumour. Accordingly, strong oxygen gradients are present that result in strongly heterogeneous tumour cell proliferation and shape instability. The color scheme is the same as in Fig. 2 and the times shown are t = 48 (3 days after angiogenesis is initiated), 52.5, 67.5, 82.5, 105 and 150 days. An animation is available online with the supplementary materials
Fig. 8
Fig. 8
Dimensional intravascular radius (m) and pressure (Pa) along with the nondimensional ECM and TAF concentrations from the simulation shown in Fig. 7. The times are the same as in Fig. 7
Fig. 9
Fig. 9
The areas (mm2) of the total tumour (solid line), proliferating region (open circle), hypoxic region (closed dots) and the necrotic region (inverted triangle) as a function of time for the simulation in Fig. 7
Fig. 10
Fig. 10
The evolution towards a steady-state avascular multicell (2D) spheroid with enhanced ECM degradation. The MDE production and degradation parameters are larger than those used in Fig. 2. See the supplementary materials where there is also an animation available online. The times shown are t = 0, 15 and 45 days
Fig. 11
Fig. 11
The areas (mm2) of the total tumour (solid line), proliferating region (open circle), hypoxic region (solid dot) and the necrotic region (inverted triangle) as a function of time for the simulation in Fig. 10
Fig. 12
Fig. 12
Tumour-induced angiogenesis and vascular tumour growth with enhanced ECM degradation. The times shown are t = 48 (3 days after angiogenesis is initiated), 52.5, 67.5, 82.5, 105 and 150 days. An animation is available online with the supplementary materials
Fig. 13
Fig. 13
Dimensional intravascular radius (m) and pressure (Pa) along with the nondimensional ECM and TAF concentrations from the simulation in Fig. 12. The times are the same as in Fig. 12
Fig. 14
Fig. 14
The areas (mm2) of the total tumour (solid line), proliferating region (open circle), hypoxic region (solid dot) and the necrotic region (inverted triangle) as a function of time for the simulation in Fig. 12
Fig. 15
Fig. 15
Left predicted tumour morphological response to microenvironmental nutrient availability (increases along horizontal axis) and biomechanical responsiveness (increases along vertical axis) from [47] (reprinted with permission from Elsevier). Right Tumour morphology and ECM profile at 150 days with enhanced matrix degradation (top, Sect. 4.5) and lower matrix degradation (bottom, Sect. 4.3)
Fig. 16
Fig. 16
Average vessel radii. Simulation from Fig. 7 (solid), simulation from Fig. 4. (solid dots), simulation from Fig. 12 (diamond)

References

    1. Alarcón T, Byrne HM, Maini PK. A multiple scale model for tumor growth. Multiscale Model Simul. 2005;3:440–475.
    1. Ambrosi D, Preziosi L. On the closure of mass balance models for tumor growth. Math Model Meth Appl Sci. 2002;12(5):737–754.
    1. Anderson ARA. A hybrid mathematical model of solid tumour invasion: the importance of cell adhesion. IMA Math App Med Biol. 2005;22(2):163–186. - PubMed
    1. Anderson ARA, Chaplain MAJ. Continuous and discrete mathematical models of tumor-induced angiogenesis. Bull Math Biol. 1998;60(5):857–900. - PubMed
    1. Anderson ARA, Weaver AM, Cummings PT, Quaranta V. Tumor morphology and phenotypic evolution driven by selective pressure from the microenvironment. Cell. 2006;127(5):905–915. - PubMed

Publication types

MeSH terms

LinkOut - more resources