

Skew in T cell receptor usage with polyclonal expansion in lesions of oral lichen planus without hepatitis C virus infection
- PMID: 18782324
- PMCID: PMC2612723
- DOI: 10.1111/j.1365-2249.2008.03763.x
Skew in T cell receptor usage with polyclonal expansion in lesions of oral lichen planus without hepatitis C virus infection
Abstract
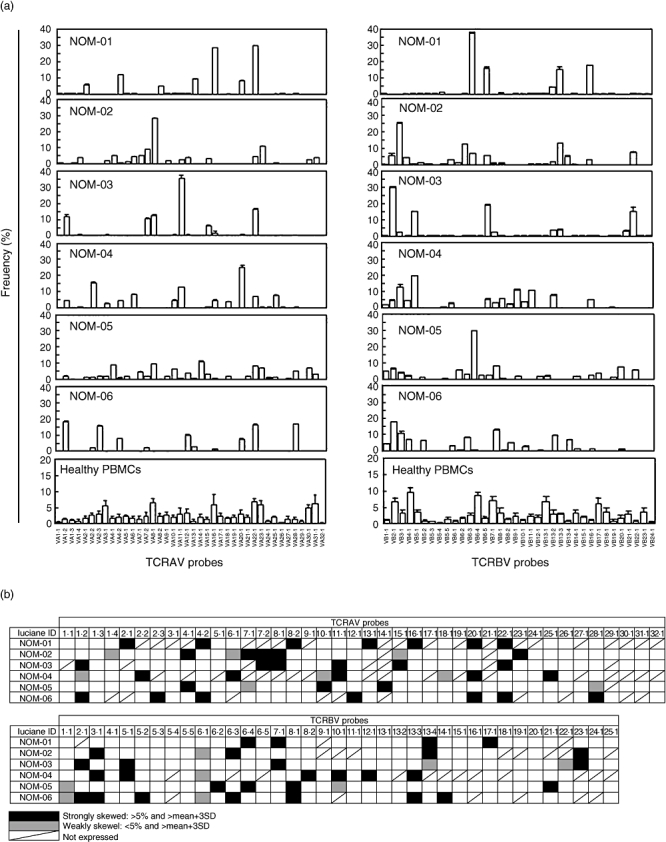
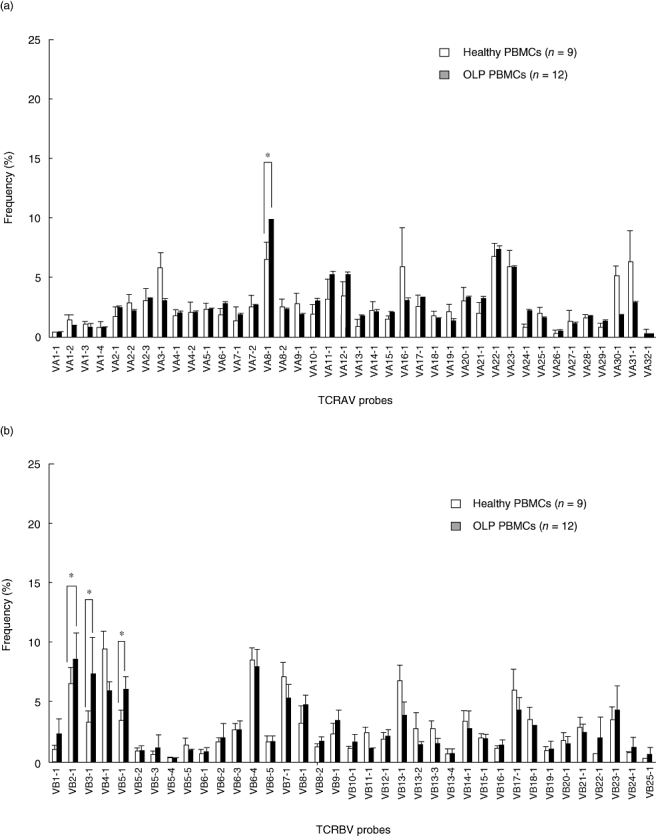
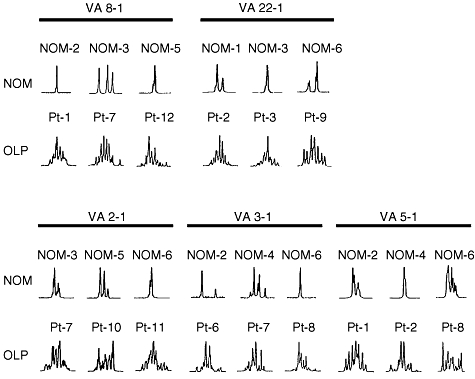
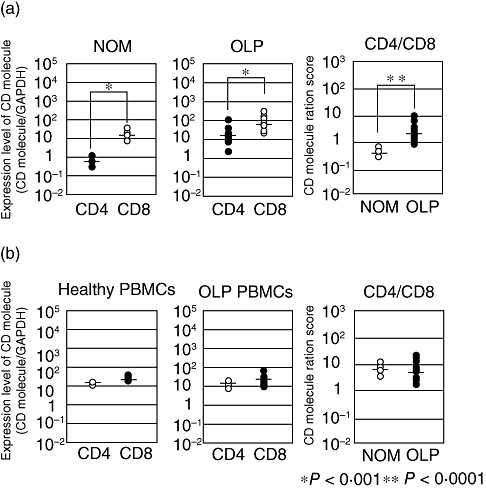
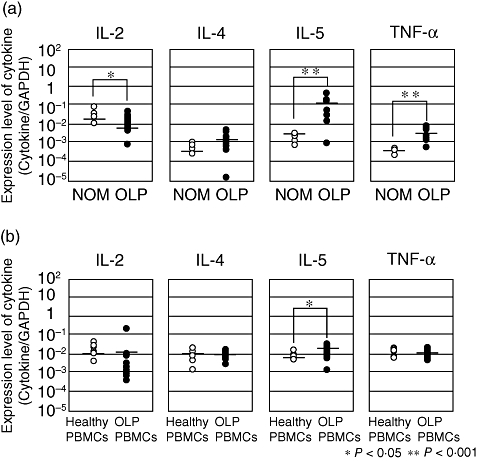
Oral lichen planus (OLP) is a refractory disorder of the oral mucosa. Its predominant symptoms are pain and haphalgesia that impair the quality of life of patients. OLP develops via a T cell-mediated immune process. Here, we examined the characteristics of the infiltrating T cells in terms of the T cell receptor (TCR) repertoires, T cell clonality, T cell phenotypes and cytokine production profiles. TCR repertoire analyses and CDR3 size spectratyping were performed using peripheral blood mononuclear cells (PBMCs) and tissue specimens of OLP biopsies from 12 patients. The cytokine expression profiles and T cell phenotypes were measured by real-time quantitative polymerase chain reaction. We observed that there were skewed TCR repertoires in the tissue samples (TCRVA8-1, VA22-1, VB2-1, VB3-1 and VB5-1) and PBMCs (TCRVA8-1, VB2-1, VB3-1 and VB5-1) from OLP patients. Furthermore, the CDR3 distributions in the skewed TCR subfamilies exhibited polyclonal patterns. We observed increases in CD4(+) T lymphocytes, interleukin (IL)-5, tumour necrosis factor (TNF)-alpha and human leucocyte antigen D-related in the OLP tissue specimens. Taken together, the present results suggest that T cells bearing these TCRs are involved in the pathogenesis of OLP, and that IL-5 and TNF-alpha may participate in its inflammatory process.
Figures


Similar articles
-
T-cell receptor V beta usage by lesional lymphocytes in oral lichen planus.J Oral Pathol Med. 1997 Mar;26(3):105-9. doi: 10.1111/j.1600-0714.1997.tb00031.x. J Oral Pathol Med. 1997. PMID: 9083933
-
T cell receptor V-gene usage in oral lichen planus; increased frequency of T cell receptors expressing V alpha 2 and V beta 3.Clin Exp Immunol. 1994 Dec;98(3):503-7. doi: 10.1111/j.1365-2249.1994.tb05519.x. Clin Exp Immunol. 1994. PMID: 7994913 Free PMC article.
-
Role of distinct CD4(+) T helper subset in pathogenesis of oral lichen planus.J Oral Pathol Med. 2016 Jul;45(6):385-93. doi: 10.1111/jop.12405. Epub 2015 Dec 23. J Oral Pathol Med. 2016. PMID: 26693958 Review.
-
CD4+CD8αα+ is the dominant phenotype of intraepithelial lymphocytes and regulated by ThPOK and Runx3 in oral lichen planus.J Oral Pathol Med. 2024 Aug;53(7):480-490. doi: 10.1111/jop.13564. Epub 2024 Jun 12. J Oral Pathol Med. 2024. PMID: 38866540
-
Cytokine profiles contribute to understanding the pathogenic difference between Good syndrome and oral lichen planus: two case reports and literature review.Medicine (Baltimore). 2015 Apr;94(14):e704. doi: 10.1097/MD.0000000000000704. Medicine (Baltimore). 2015. PMID: 25860215 Free PMC article. Review.
Cited by
-
CXCL9, CXCL10, and CCL19 synergistically recruit T lymphocytes to skin in lichen planus.JCI Insight. 2024 Oct 22;9(20):e179899. doi: 10.1172/jci.insight.179899. JCI Insight. 2024. PMID: 39190494 Free PMC article.
-
Possible Immune Regulation of Natural Killer T Cells in a Murine Model of Metal Ion-Induced Allergic Contact Dermatitis.Int J Mol Sci. 2016 Jan 12;17(1):87. doi: 10.3390/ijms17010087. Int J Mol Sci. 2016. PMID: 26771600 Free PMC article. Review.
-
Peripheral and local human papillomavirus 16-specific CD8+ T-cell expansions characterize erosive oral lichen planus.J Invest Dermatol. 2015 Feb;135(2):418-424. doi: 10.1038/jid.2014.397. Epub 2014 Sep 10. J Invest Dermatol. 2015. PMID: 25207820
-
Comorbidities in Lichen Planus: A Case-control Study in Indian Patients.Indian Dermatol Online J. 2019 Jan-Feb;10(1):34-37. doi: 10.4103/idoj.IDOJ_48_18. Indian Dermatol Online J. 2019. PMID: 30775296 Free PMC article.
-
Proliferation and apoptosis of peripheral blood mononuclear cells in patients with oral lichen planus.Inflammation. 2013 Apr;36(2):419-25. doi: 10.1007/s10753-012-9561-3. Inflammation. 2013. PMID: 23135214
References
-
- Sugerman PB, Savage NW, Walsh LJ, et al. The pathogenesis of oral lichen planus. Crit Rev Oral Biol Med. 2002;13:350–65. - PubMed
-
- Sugerman PB, Savage NW, Zhou X, Walsh LJ, Bigby M. Oral lichen planus. Clin Dermatol. 2000;18:533–9. - PubMed
-
- Walton LJ, Thornhill MH, Farthing PM. T cell antigen receptor expression by intra-epithelial lymphocytes in oral lichen planus. J Oral Pathol Med. 1996;25:534–7. - PubMed
-
- Thomas DW, Stephens P, Stephens M, Patten DW, Lim SH. T-cell receptor V beta usage by lesional lymphocytes in oral lichen planus. J Oral Pathol Med. 1997;26:105–9. - PubMed
Publication types
MeSH terms
Substances
LinkOut - more resources
Full Text Sources
Other Literature Sources
Research Materials
