

Probing the interaction between the coiled coil leucine zipper of cGMP-dependent protein kinase Ialpha and the C terminus of the myosin binding subunit of the myosin light chain phosphatase
- PMID: 18782776
- PMCID: PMC2583292
- DOI: 10.1074/jbc.M804916200
Probing the interaction between the coiled coil leucine zipper of cGMP-dependent protein kinase Ialpha and the C terminus of the myosin binding subunit of the myosin light chain phosphatase
Abstract
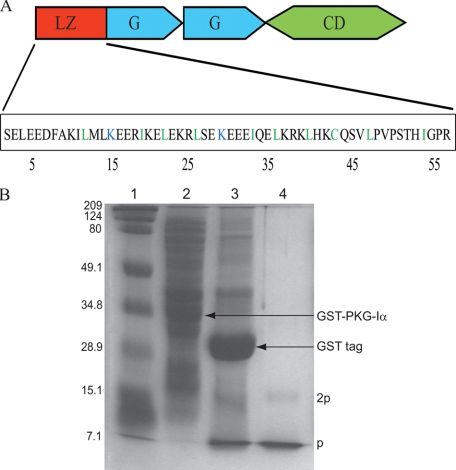
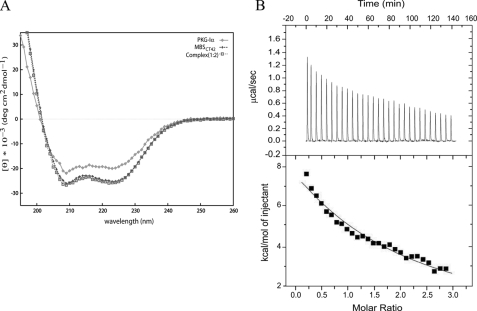
Nitric oxide and nitrovasodilators induce vascular smooth muscle cell relaxation in part by cGMP-dependent protein kinase I (PKG-Ialpha)-mediated activation of myosin phosphatase (MLCP). Mechanistically it has been proposed that protein-protein interactions between the N-terminal leucine zipper (LZ) domain of PKG-Ialpha ((PKG-Ialpha(1-59)) and the LZ and/or coiled coil (CC) domain of the myosin binding subunit (MBS) of MLCP are localized in the C terminus of MBS. Although recent studies have supported these interactions, the critical amino acids responsible for these interactions have not been identified. Here we present structural and biophysical data identifying that the LZ domain of PKG-Ialpha(1-59) interacts with a well defined 42-residue CC motif (MBS(CT42)) within the C terminus of MBS. Using glutathione S-transferase pulldown experiments, chemical cross-linking, size exclusion chromatography, circular dichroism, and isothermal titration calorimetry we identified a weak dimer-dimer interaction between PKG-Ialpha(1-59) and this C-terminal CC domain of MBS. The K(d) of this non-covalent complex is 178.0+/-1.5 microm. Furthermore our (1)H-(15)N heteronuclear single quantum correlation NMR data illustrate that this interaction is mediated by several PKG-Ialpha residues that are on the a, d, e, and g hydrophobic and electrostatic interface of the C-terminal heptad layers 2, 4, and 5 of PKG-Ialpha. Taken together these data support a role for the LZ domain of PKG-Ialpha and the CC domain of MBS in this requisite contractile complex.
Figures
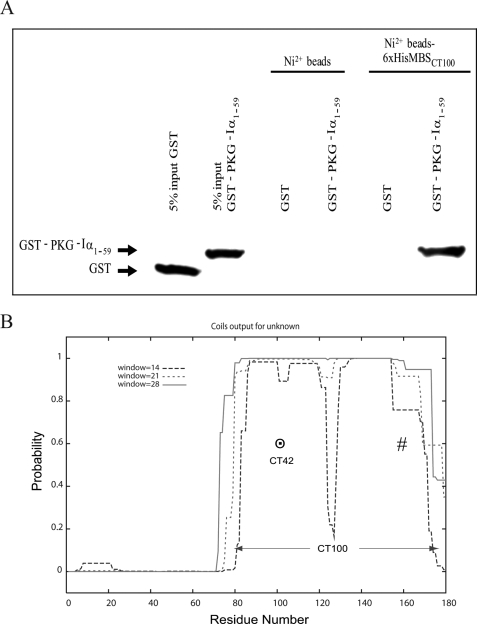
 and #, respectively, within
the C-terminal 100 residues, MBS
and #, respectively, within
the C-terminal 100 residues, MBS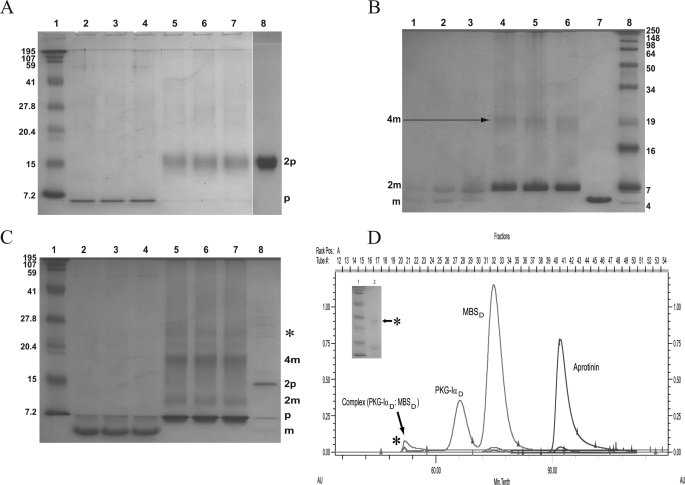


Similar articles
-
NMR insight into myosin-binding subunit coiled-coil structure reveals binding interface with protein kinase G-Iα leucine zipper in vascular function.J Biol Chem. 2017 Apr 28;292(17):7052-7065. doi: 10.1074/jbc.M117.781260. Epub 2017 Mar 9. J Biol Chem. 2017. PMID: 28280239 Free PMC article.
-
Expression, purification, and characterization of coiled coil and leucine zipper domains of C-terminal myosin binding subunit of myosin phosphatase for solution NMR studies.Protein Expr Purif. 2012 Jan;81(1):126-135. doi: 10.1016/j.pep.2011.09.013. Epub 2011 Oct 7. Protein Expr Purif. 2012. PMID: 22005452
-
The structural determinations of the leucine zipper coiled-coil domains of the cGMP-dependent protein kinase Iα and its interaction with the myosin binding subunit of the myosin light chains phosphase.Protein Pept Lett. 2011 Oct;18(10):966-78. doi: 10.2174/0929866511107010966. Protein Pept Lett. 2011. PMID: 21592084 Review.
-
Dimerization of cGMP-dependent protein kinase 1alpha and the myosin-binding subunit of myosin phosphatase: role of leucine zipper domains.Cell Signal. 2003 Oct;15(10):937-44. doi: 10.1016/s0898-6568(03)00057-3. Cell Signal. 2003. PMID: 12873707
-
Myosin light chain phosphatase: subunit composition, interactions and regulation.J Muscle Res Cell Motil. 1998 May;19(4):325-41. doi: 10.1023/a:1005385302064. J Muscle Res Cell Motil. 1998. PMID: 9635276 Review.
Cited by
-
Tissue-specific expression of myosin phosphatase subunits and isoforms in smooth muscle of mice and humans.Am J Physiol Regul Integr Comp Physiol. 2022 Apr 1;322(4):R281-R291. doi: 10.1152/ajpregu.00196.2021. Epub 2022 Feb 2. Am J Physiol Regul Integr Comp Physiol. 2022. PMID: 35107022 Free PMC article.
-
Analysis of protein pathway networks using hybrid properties.Molecules. 2010 Nov 12;15(11):8177-92. doi: 10.3390/molecules15118177. Molecules. 2010. PMID: 21076385 Free PMC article.
-
Aging related decreases in NM myosin expression and contractility in a resistance vessel.Front Physiol. 2024 May 14;15:1411420. doi: 10.3389/fphys.2024.1411420. eCollection 2024. Front Physiol. 2024. PMID: 38808359 Free PMC article.
-
NMR insight into myosin-binding subunit coiled-coil structure reveals binding interface with protein kinase G-Iα leucine zipper in vascular function.J Biol Chem. 2017 Apr 28;292(17):7052-7065. doi: 10.1074/jbc.M117.781260. Epub 2017 Mar 9. J Biol Chem. 2017. PMID: 28280239 Free PMC article.
-
Characterizing the Protein Isoforms of foraging (for), the PKGI Ortholog in Drosophila melanogaster.Int J Mol Sci. 2023 Jun 16;24(12):10219. doi: 10.3390/ijms241210219. Int J Mol Sci. 2023. PMID: 37373366 Free PMC article.
References
-
- Surks, H. K., Mochizuki, N., Kasai, Y., Georgescue, S. P., Tang, K. M., Ito, M., Lincoln, T. M., and Mendelsohn, M. E. (1999) Science 286 1583-1587 - PubMed
-
- Surks, H. K., and Mendelsohn, M. E. (2003) Cell. Signal. 15 937-944 - PubMed
-
- Somlyo, A. P., and Somlyo, A. V. (1994) Nature 372 231-236 - PubMed
-
- Hartshorne, D. J., and Hirano, K. (1999) Mol. Cell. Biochem. 190 79-84 - PubMed
Publication types
MeSH terms
Substances
Grants and funding
LinkOut - more resources
Full Text Sources
Molecular Biology Databases
