. 2008 Oct;36(18):5763-72.
doi: 10.1093/nar/gkn574. Epub 2008 Sep 9.

Expanded binding specificity of the human histone chaperone NASP

Affiliations

Expanded binding specificity of the human histone chaperone NASP

Huanyu Wang et al. Nucleic Acids Res. 2008 Oct.

Abstract

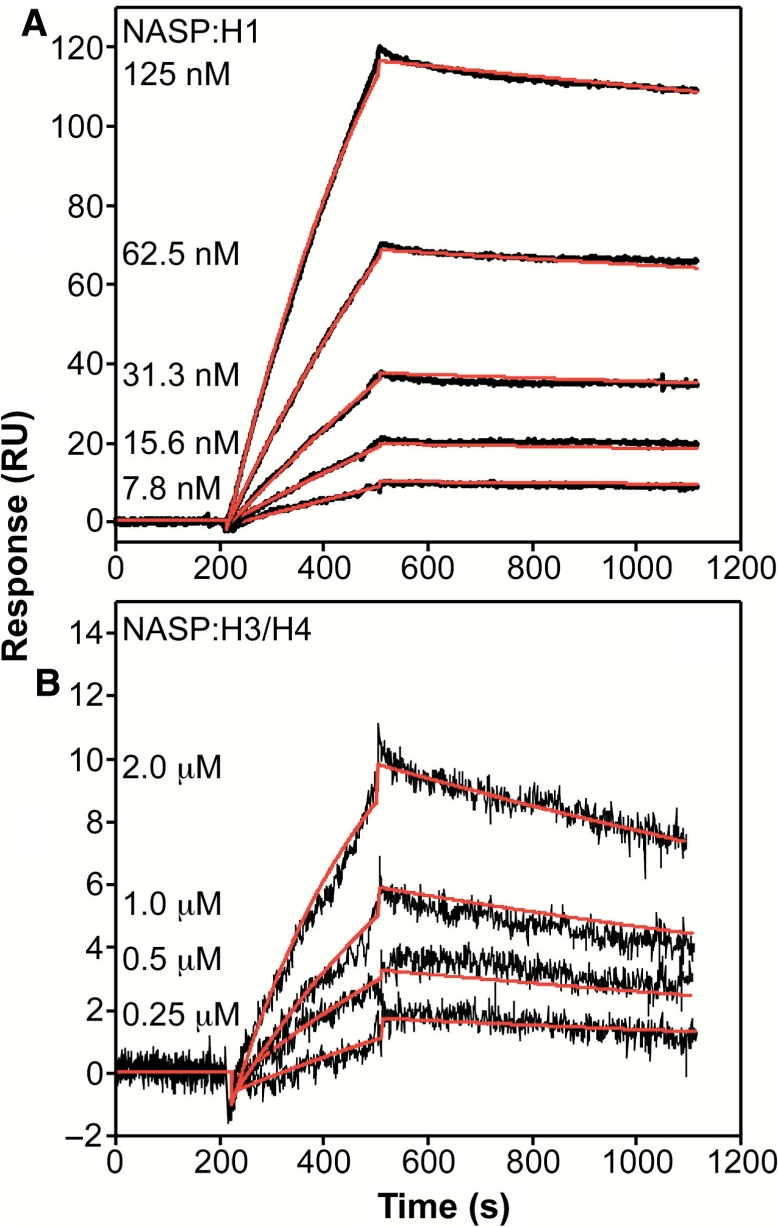
NASP (nuclear autoantigenic sperm protein) has been reported to be an H1-specific histone chaperone. However, NASP shares a high degree of sequence similarity with the N1/N2 family of proteins, whose members are H3/H4-specific histone chaperones. To resolve this paradox, we have performed a detailed and quantitative analysis of the binding specificity of human NASP. Our results confirm that NASP can interact with histone H1 and that this interaction occurs with high affinity. In addition, multiple in vitro and in vivo experiments, including native gel electrophoresis, traditional and affinity chromatography assays and surface plasmon resonance, all indicate that NASP also forms distinct, high specificity complexes with histones H3 and H4. The interaction between NASP and histones H3 and H4 is functional as NASP is active in in vitro chromatin assembly assays using histone substrates depleted of H1.


Figures

Figure 1.
Figure 1.
Native gel electrophoresis of sNASP:histone complexes. (A) A schematic diagram representing the conservation of sequence and domain structure between sNASP, N1 and Hif1p. (B and C) A total of 1.5 μg recombinant sNASP was incubated alone (lanes 8 and 16) or with increasing amount of histone H3/H4 (0.36, 0.81, 1.26, 1.71, 2.16 and 2.61 μg, lanes 1–6), histone H1 (0.4, 0.9, 1.4, 1.9, 2.5 and 2.9 μg, lanes 9–14) or 1.5 μg of total chicken histone (lanes 7 and 15) in the presence of DN (300) with a total volume of 30 μl. After incubation, 12 μl of each mixture was analyzed by either native gel electrophoresis (B) or SDS–PAGE (C). Proteins were visualized by Coomassie Blue staining. The migration of sNASP:histone complexes is denoted by asterisks in (B).
Figure 2.
Figure 2.
sNASP forms a stable complex with histones H3 and H4. (A) Purified recombinant sNASP (150 μg) and chicken erythrocyte histones (200 μg) were mixed (input) and resolved by gel filtration chromatography (Superose 6). Fractions (indicated by numbers at top of gels) were resolved by SDS–AGE and visualized by Coomassie Blue staining. A 4.8% of the input and each fraction were electrophoresed. The elution positions of standards are indicated at the top. (B) Purified chicken erythrocyte histones were chromatographed and visualized as above.
Figure 3.
Figure 3.
Correlation between sNASP:H3/H4 complexes detected by gel filtration chromatography and native gel electrophoresis. (A) sNASP (100 μg) was incubated with total chicken erythrocyte histones (150 μg) and resolved on a Superose 6 column. Fractions containing sNASP and histones H3 and H4 (labeled at the top of the gel) were resolved by SDS–PAGE and visualized by Coomassie Blue staining. (B) The indicated fractions from the Superose 6 column were directly resolved by native gel electrophoresis and visualized with Coomassie Blue staining. Recombinant sNASP was also analyzed alone (lane 11) or following incubation with total chicken erythrocyte histones (lane 10). The migration of sNASP:histone complexes is indicated by asterisks.
Figure 4.
Figure 4.
Detection of sNASP:H3/H4 complex formation by affinity chromatography. (A) Purified recombinant sNASP (150 μg) and chicken erythrocyte histones (200 μg) were incubated in a total volume of 1.0 ml (input) and chromatographed on a Ni2+ chelate column. The first six fractions to wash off the column after loading (wash) and the first six fractions to elute with 500 mM imidazole buffer (elute) were resolved by SDS–PAGE and visualized by Coomassie Blue staining. A 0.24% of the input and 2.4% of each fraction was loaded on the gel. The position of each protein in the gel is indicated on the left. (B) Purified chicken erythrocyte histones (300 μg) were chromatographed and visualized as above except that 0.75% of the input was run on the gel. (C) Purified sNASP (200 μg) was incubated with bovine histone H1 (500 μg) in a total volume of 1.0 ml and chromatographed on a Ni2+ chelate column. The first five fractions to wash off the column after loading (wash) and the first five fractions to elute with 500 mM imidazole buffer (elute) were resolved by SDS–PAGE and visualized by Coomassie Blue staining. A 0.24% of the input and 2.4% of each fraction was loaded on the gel.
Figure 5.
Figure 5.
Recombinant sNASP primarily interacts with histone H3. (A) Purified sNASP (200 μg) was incubated with recombinant X. laevis histone H3 (100 μg) in a total volume of 1.0 ml and chromatographed on a Ni2+ chelate column. The first seven fractions to wash off the column after loading (wash) and the first seven fractions to elute with 500 mM imidazole buffer (elute) were resolved by SDS–PAGE and visualized by Coomassie Blue staining. A 0.24% of the input and 2.4% of each fraction was loaded on the gel. (B) Purified sNASP (200 μg) was incubated with recombinant X. laevis histone H4 (76 μg) in a total volume of 1.0 ml and chromatographed on a Ni2+ chelate column. Fractions were analyzed as described above.
Figure 6.
Figure 6.
Quantitation of the interactions between sNASP and histones H1 and H3/H4 by SPR. SPR binding kinetic sensorgrams for the interactions of NASP with H1 (A) and H3/H4 (B). The black curves are the trimmed sensorgrams collected at a flow rate of 50 μl/min in HBS-EP buffer at 25°C. Global fits of the data according to the model described in the Materials and methods section are in red, and the resulting kinetic rate constants are tabulated in Table 1.
Figure 7.
Figure 7.
sNASP interacts with both histone H1 and histone H3 in vivo. HeLa cell nuclear extract (input) was incubated with coupling gel with (lane 4) or without being conjugated to anti-NASP antibody (lane 4). Five microliters of the input (lane 1) and unbound (lane 2) fractions and 12 μl of the bound fractions were resolved by SDS–PAGE and the proteins visualized by western blots probed with antibodies recognizing the proteins indicated on the right.
Figure 8.
Figure 8.
Recombinant sNASP can assemble core histones into chromatin. Chromatin assembly activity of recombinant sNASP with core histones was assayed by incubating the indicated factors with a relaxed circular plasmid. After incubation, the plasmids were extracted and resolved by 1.5% agarose gel electrophoresis, and visualized by SYBR Gold nucleic acid stain. The migration of the supercoiled (S) and relaxed (R) forms of the plasmid are indicated by arrows. Lanes 1 and 2 show the template DNA before and after relaxation, respectively.

Similar articles

Cited by

References

    1. Akey CW, Luger K. Histone chaperones and nucleosome assembly. Curr. Opin. Struct. Biol. 2003;13:6–14. - PubMed
    1. Polo SE, Almouzni G. Chromatin assembly: a basic recipe with various flavours. Curr. Opin. Genet. Dev. 2006;16:104–111. - PubMed
    1. Jin J, Cai Y, Li B, Conaway RC, Workman JL, Conaway JW, Kusch T. In and out: histone variant exchange in chromatin. Trends Biochem. Sci. 2005;30:680–687. - PubMed
    1. Loyola A, Almouzni G. Histone chaperones, a supporting role in the limelight. Biochim. Biophys. Acta. 2004;1677:3–11. - PubMed
    1. Kleinschmidt JA, Dingwall C, Maier G, Franke WW. Molecular characterization of a karyophilic, histone-binding protein: cDNA cloning, amino acid sequence and expression of nuclear protein N1/N2 of Xenopus laevis. EMBO J. 1986;5:3547–3552. - PMC - PubMed

Publication types