. 2008 Dec 1;416(2):161-77.
doi: 10.1042/BJ20081240.

Molecular, biochemical and functional characterizations of C1q/TNF family members: adipose-tissue-selective expression patterns, regulation by PPAR-gamma agonist, cysteine-mediated oligomerizations, combinatorial associations and metabolic functions

Affiliations

Molecular, biochemical and functional characterizations of C1q/TNF family members: adipose-tissue-selective expression patterns, regulation by PPAR-gamma agonist, cysteine-mediated oligomerizations, combinatorial associations and metabolic functions

G William Wong et al. Biochem J. .

Abstract

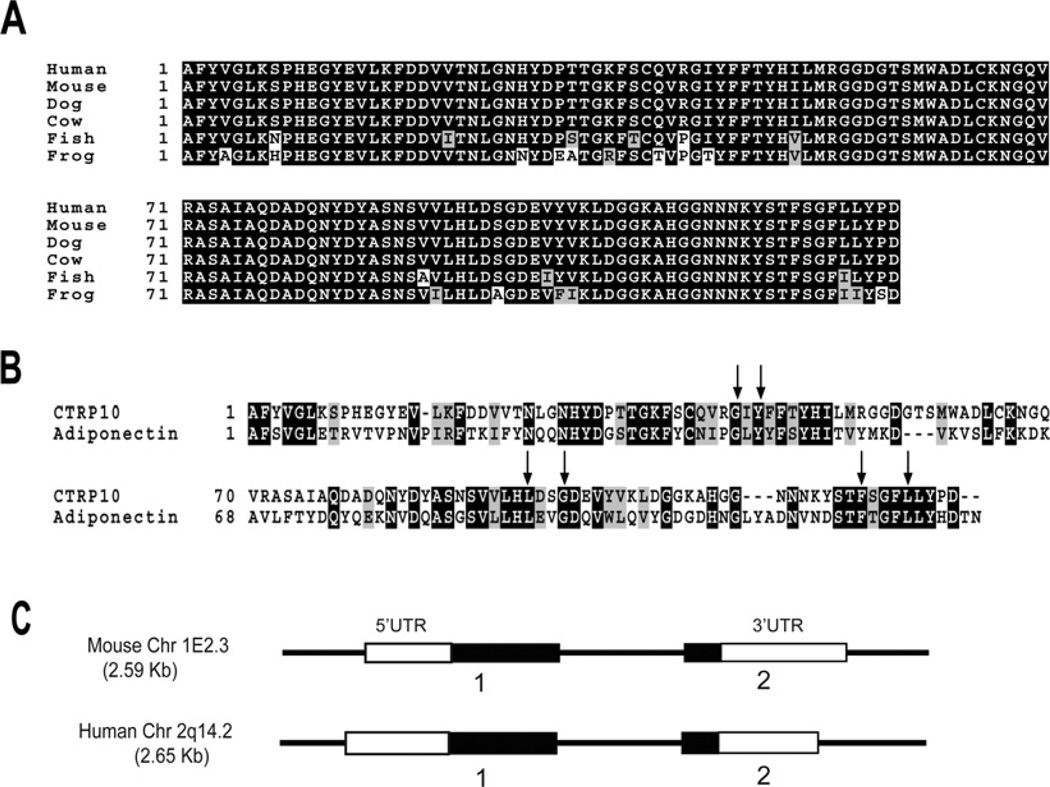
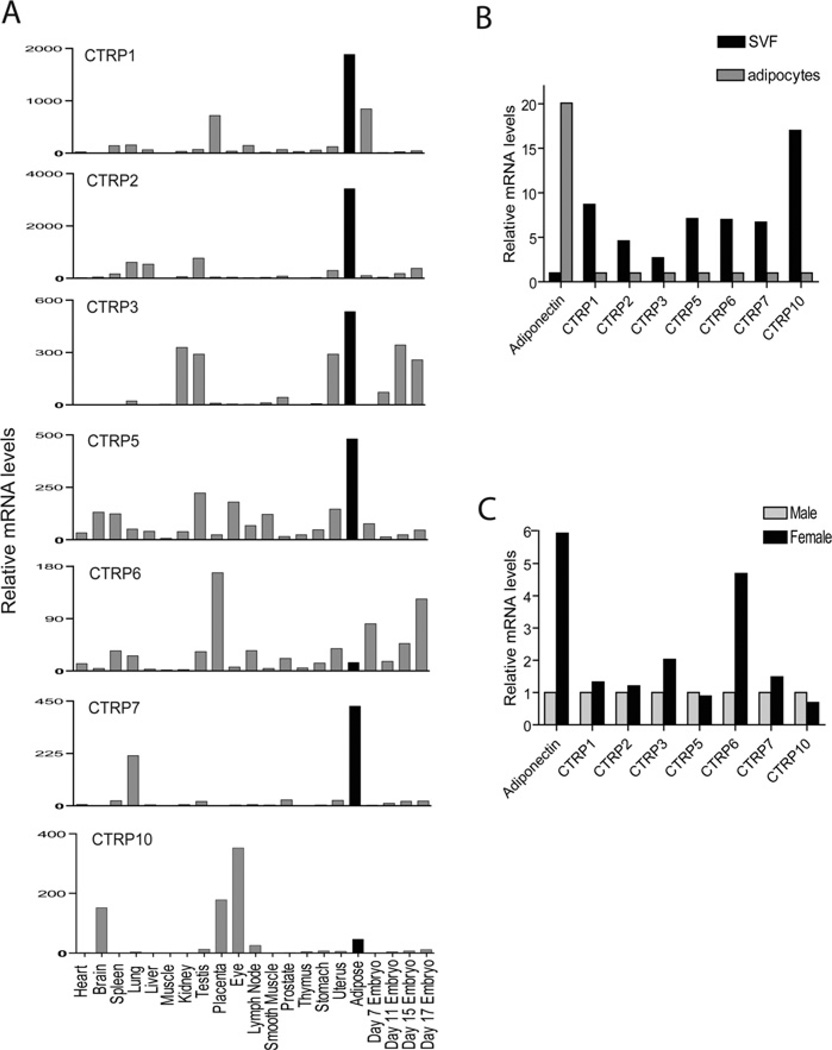
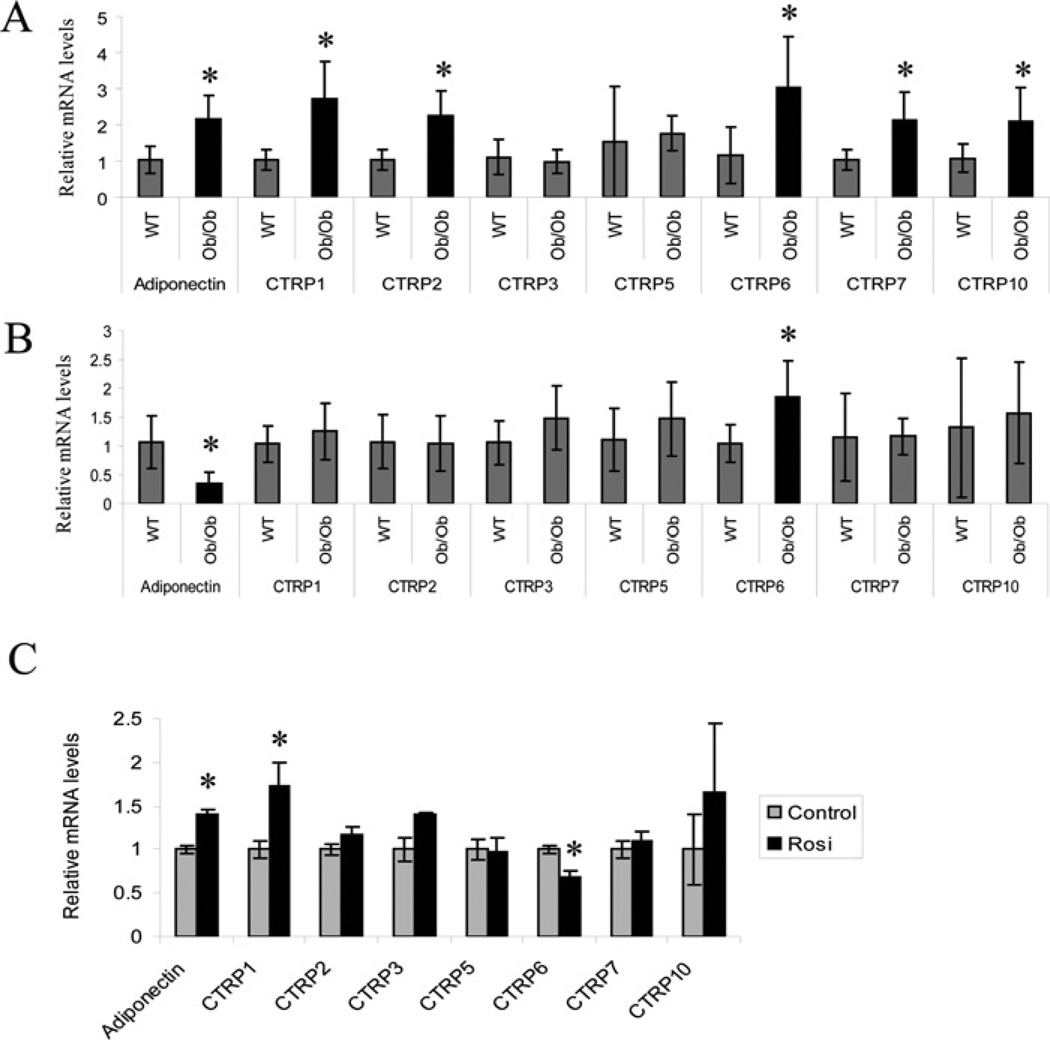
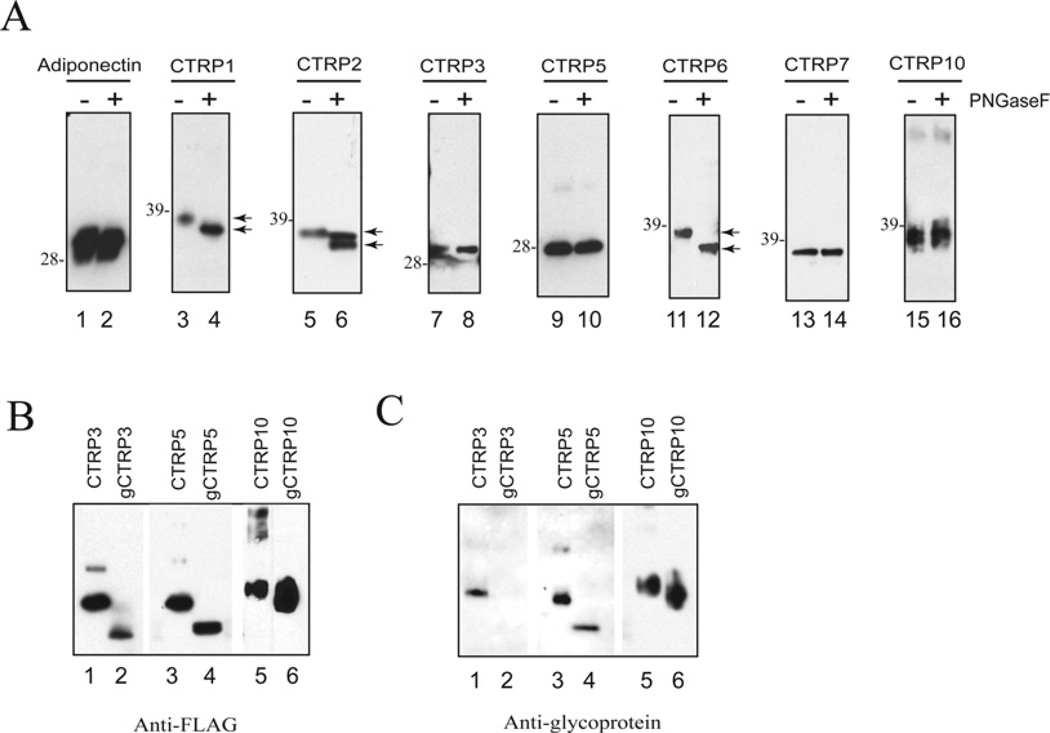
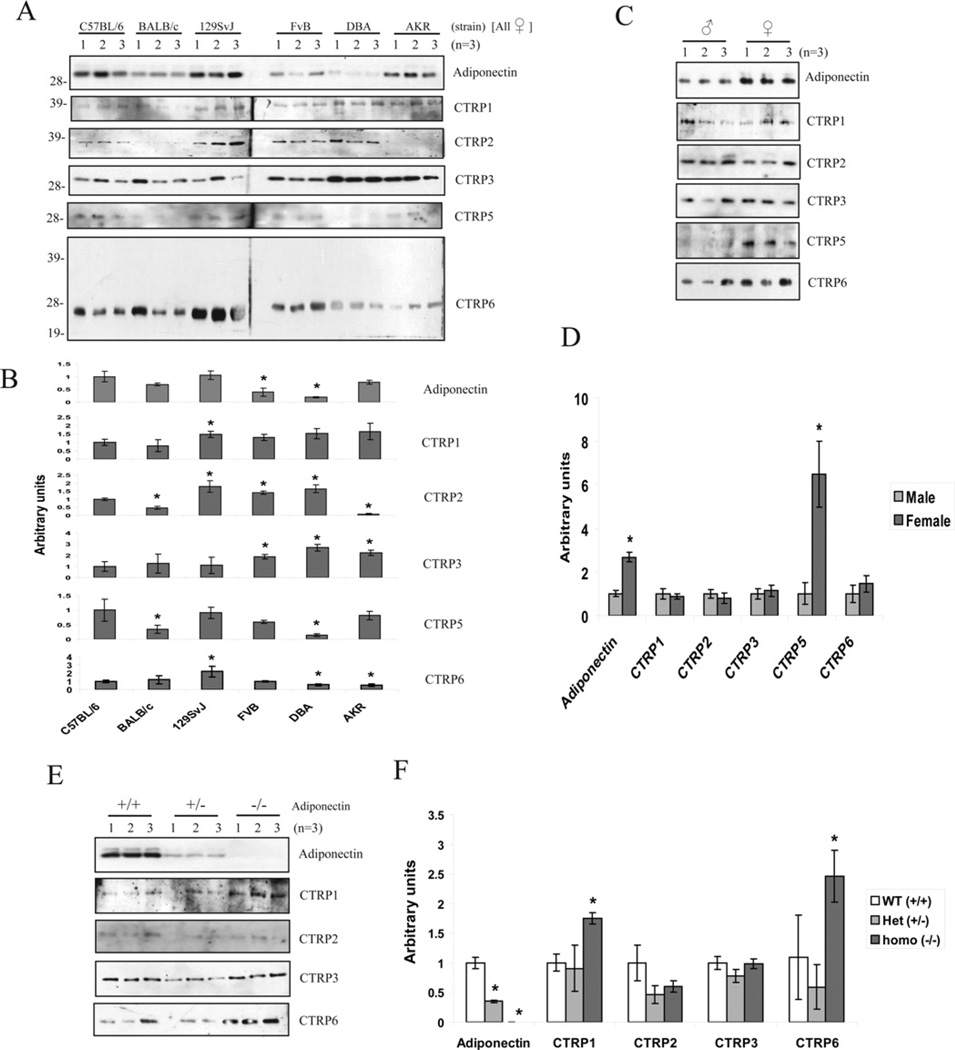
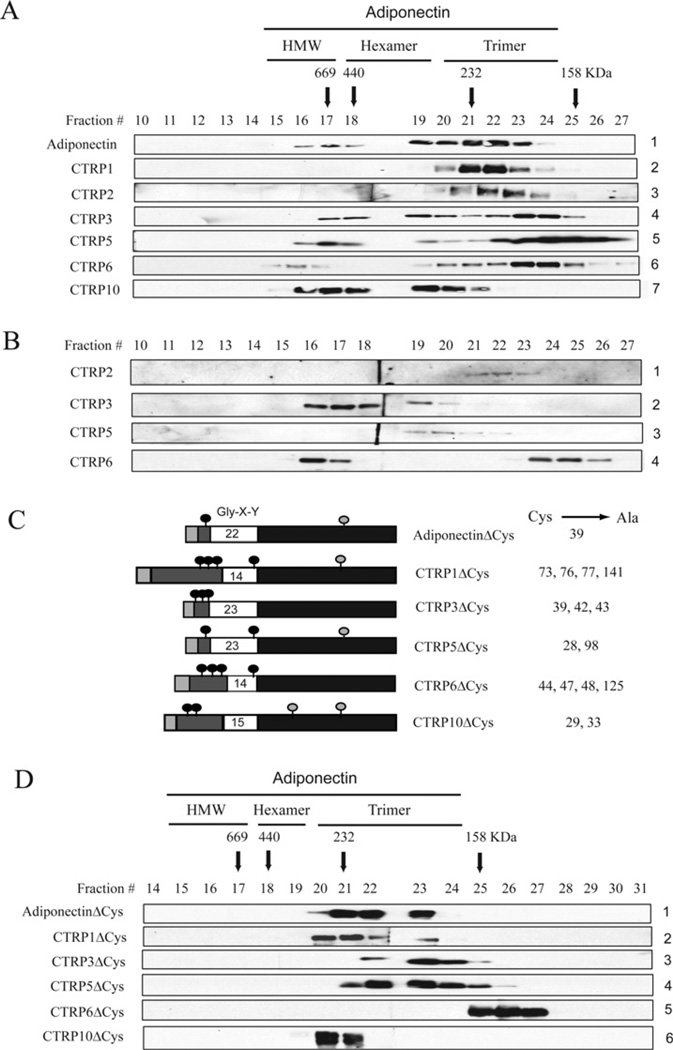
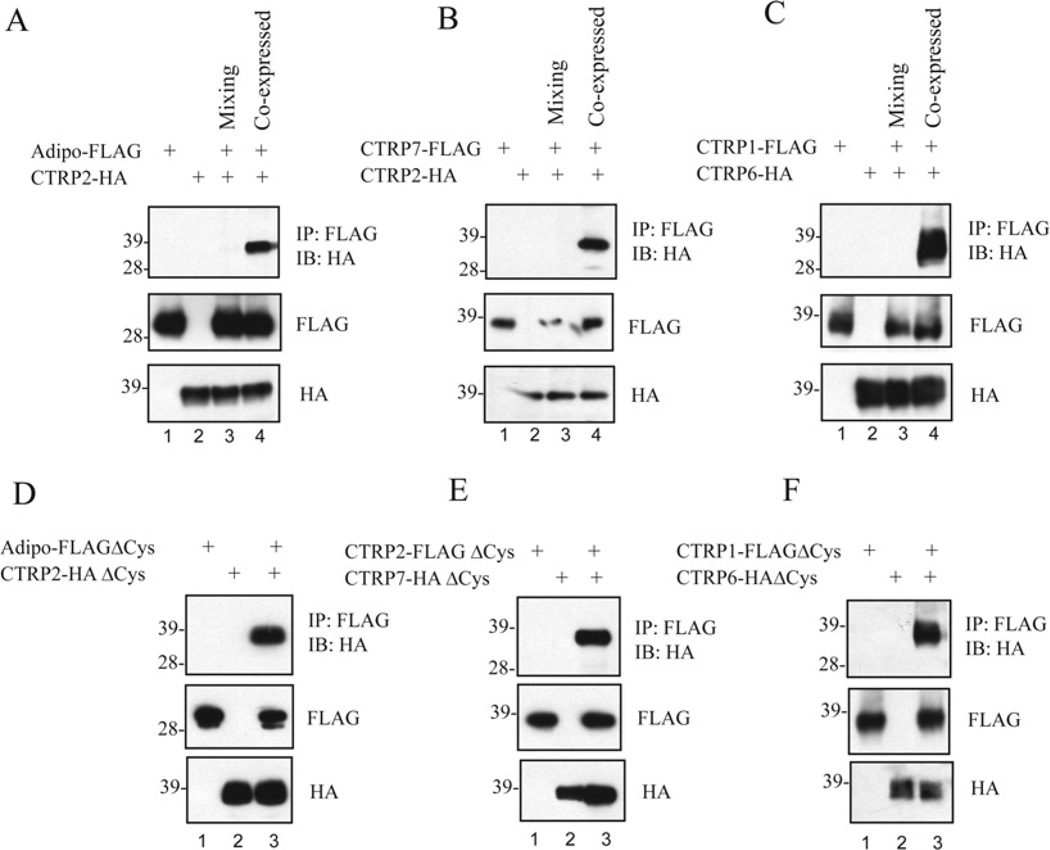
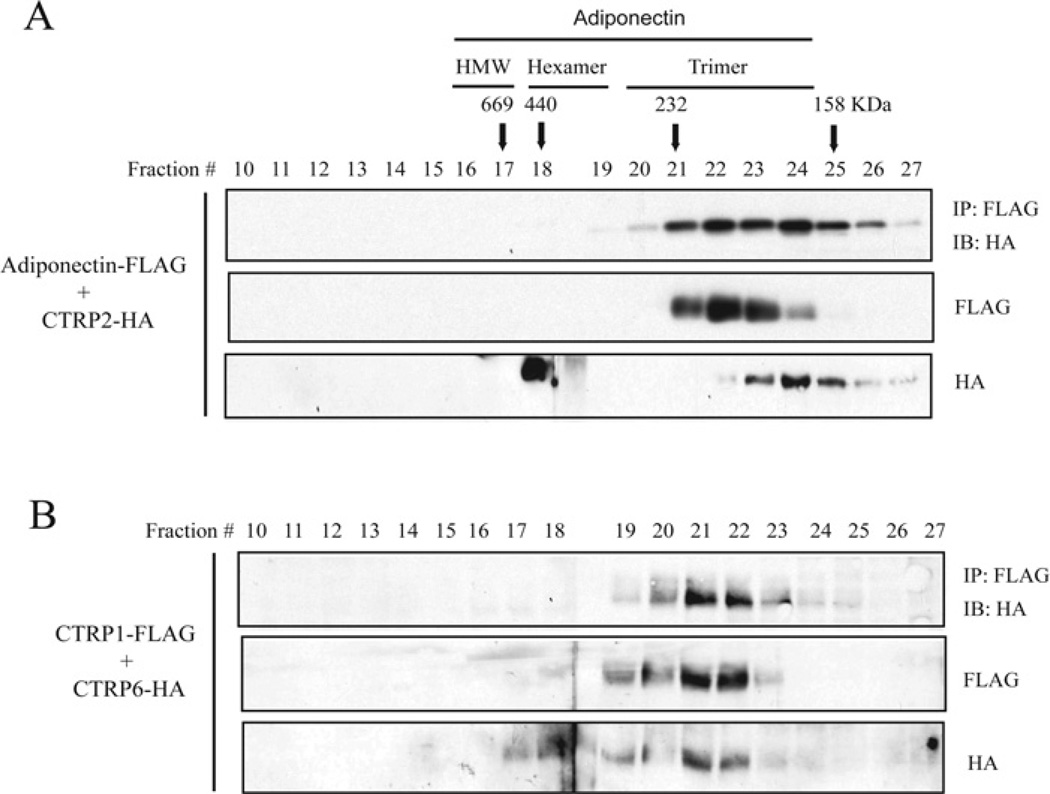
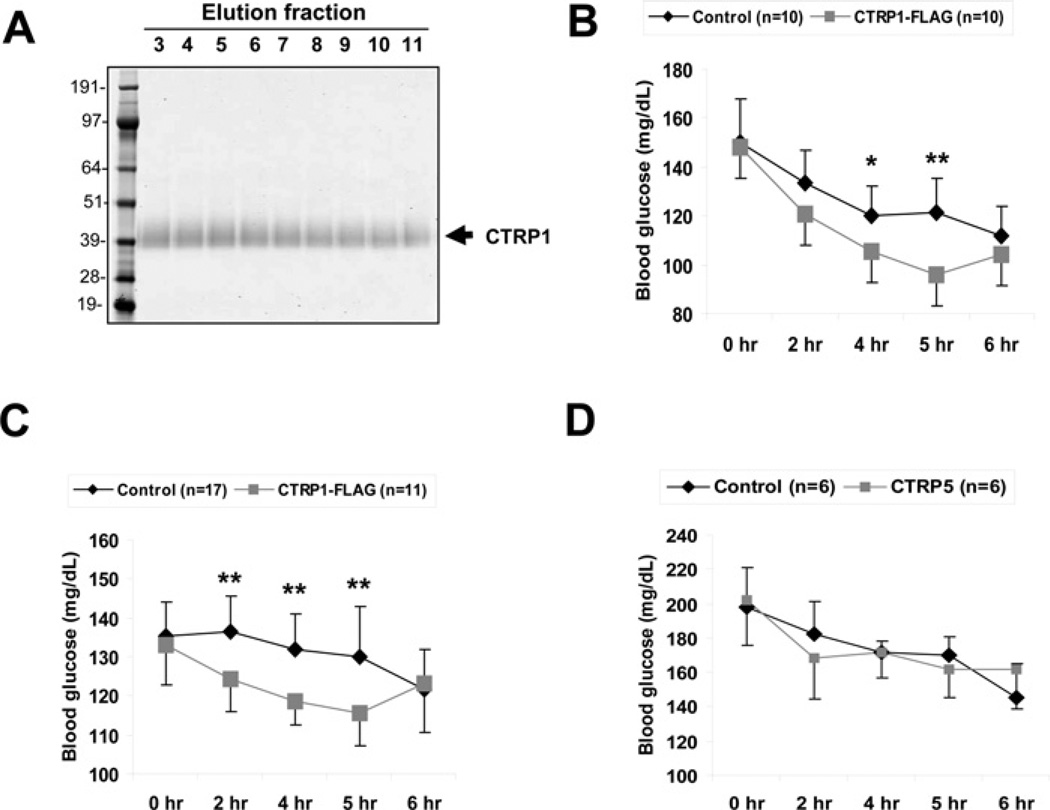
The insulin-sensitizing hormone, adiponectin, belongs to the expanding C1q/TNF (tumour necrosis factor) family of proteins. We recently identified a family of adiponectin paralogues designated as CTRP (C1q/TNF-related protein) 1-7, and in the present study describe CTRP10. In the present study, we show that CTRP1, CTRP2, CTRP3, CTRP5 and CTRP7 transcripts are expressed predominantly by adipose tissue. In contrast, placenta and eye expressed the highest levels of CTRP6 and CTRP10 transcripts respectively. Expression levels of CTRP1, CTRP2, CTRP3, CTRP6 and CTRP7 transcripts are up-regulated in 8-week-old obese (ob/ob) mice relative to lean controls. Treatment of mice with a PPAR-gamma (peroxisome-proliferator-activated receptor-gamma) agonist, rosiglitazone, increased the expression of CTRP1 and decreased CTRP6 transcript levels. All CTRPs are secreted glycoproteins when expressed in mammalian cells. CTRP1, CTRP2, CTRP3, CTRP5 and CTRP6 circulate in the blood and are potential endocrine hormones; their serum levels vary according to the sex and genetic background of mice. Importantly, serum levels of CTRP1 and CTRP6 are increased in adiponectin-null mice. Like adiponectin, all secreted CTRP proteins form trimers as their basic structural units. CTRP3, CTRP5, CTRP6 and CTRP10 trimers are further assembled into higher-order oligomeric complexes via disulfide bonding mediated by their N-terminal cysteine residues. Besides forming homo-oligomers, CTRP1/CTRP6, CTRP2/CTRP7 and adiponectin/CTRP2 are secreted as heterotrimers, thus providing a mechanism to potentially generate functionally distinct ligands. Functional characterization of one such family member, CTRP1, showed that it specifically activates Akt and p44/42-MAPK (mitogen-activated protein kinase) signalling pathways in differentiated mouse myotubes. Moreover, injection of recombinant CTRP1 into mice significantly reduced their serum glucose levels. Thus at least CTRP1 may be considered a novel adipokine. In summary, these molecular, biochemical and functional data provide an important framework to further address the physiological functions and mechanisms of the action of this family of secreted glycoproteins in normal and disease states.


Figures

Figure 1
Figure 1. Identification and cloning of CTRP10 cDNA
(A) ClustalW alignments of the CTRP10 globular domain sequences of human (Homo sapiens, NP_872334), mouse (Mus musculus, AAY21933), dog (C. familiaris, XP_541006), cow (B. taurus, XP_595145), pufferfish (T. nigroviridis, CAG12827) and frog (X. tropicalis, AAH88035). Identical amino acids are shown as white text on a black background. (B) ClustalW alignment of the globular domain sequences between mouse CTRP10 and adiponectin. Identical amino acids are shown as white text on a black background and gaps are indicated by dashes. Arrows indicate amino acids that are conserved between the C1q and TNF family of proteins based on the crystal structure of adiponectin [15]. (C) Exon/intron organizations of the mouse and human CTRP10 gene. The size of the mouse CTRP10 exons 1 and 2 are 1220 and 779 bp respectively. The encoded mouse cDNA has a 535 bp 5′UTR (untranslated region) and a 599 bp 3′UTR. The size of the human CTRP10 exons 1 and 2 are 1310 and 738 bp respectively. The encoded human cDNA has a 625 bp 5′UTR and a 559 bp 3′UTR. Open boxes (white) refer to exons that encode the 5′ and 3′UTR, whereas the closed boxes (black) refer to exons that code for amino acids.
Figure 2
Figure 2. Analysis of CTRP1, CTRP2, CTRP3, CTRP5, CTRP6, CTRP7 and CTRP10 transcript levels in mouse tissues, primary adipocytes and stromal cells
(A) Quantitative real-time PCR analyses of CTRP expression in mouse tissues. Expression levels of CTRP transcripts in different tissues were normalized to their corresponding GAPDH levels. The bar on the histograms that represents adipose tissue is highlighted in black. (B) Quantitative real-time PCR analyses of CTRP expressions in primary adipocytes and stromal cells [termed stromal vascular fraction (SVF)]. All PCR results were first normalized to their corresponding 18S RNA levels. The relative expression levels of CTRPs in primary adipocytes were normalized to that of SVF, which was set as 1.0. (C) Expression levels of CTRP transcripts in SVF between male and female mice were compared. For adiponectin, its expression levels in primary adipocytes were compared between male and female mice. All PCR results were first normalized to their corresponding 18S RNA levels. The relative expression levels of CTRPs in female were normalized to that of male mice, which was set as 1.0. All of these results were obtained from tissues or cells pooled from multiple mice and thus represent a single experiment.
Figure 3
Figure 3. Analysis of CTRP1, CTRP2, CTRP3, CTRP5, CTRP6, CTRP7 and CTRP10 transcript levels in adipose tissue of lean and ob/ob mice, and in mice treated with rosiglitazone
(A) Quantitative real-time PCR analyses of adiponectin and CTRP expression in epididymal fat pads of 8-week-old (n = 10) and (B) 12-week-old (n = 8) ob/ob mice and their lean controls (WT; n = 8–10). Expression levels of CTRP transcripts were first normalized to their corresponding 18S RNA levels. The expression levels of CTRPs in ob/ob mice were normalized to that of lean mice. (C) Quantitative real-time PCR analyses of adiponectin and CTRP expressions in 9-week-old male ob/ob mice dosed with 15 mg of rosiglitazone (Rosi)/kg (n = 6) or vehicle control (n = 6) once per day for 3 weeks. Expression levels of CTRP transcripts were normalized to their corresponding 18S RNA. Values are means ± S.D. *P < 0.05 (measured using Student’s t test) for rosiglitazone-treated compared with control mice.
Figure 4
Figure 4. CTRP1, CTRP2, CTRP3, CTRP5, CTRP6 and CTRP10 are secreted glycoproteins
(A) Supernatants containing C-terminal FLAG-tagged CTRPs were incubated with (+) or without (−) PNGase F to determine the presence of N-linked glycans. Arrows indicate changes in protein size before and after PNGase F treatment. The molecular mass in kDa is indicated on the left-hand side of each gel. (B and C) Recombinant FLAG-tagged CTRP3, CTRP5, CTRP10 and their corresponding collagen domain-deleted globular forms (g-CTRP3, g-CTRP5 and g-CTRP10) were subjected to SDS/PAGE immunoblot analysis. The blot on the left-hand side (B) was probed with an anti-FLAG antibody. The blot on the right-hand side (C) was subjected to glycoprotein detection analysis (see the Materials and methods section) to reveal the presence of carbohydrates.
Figure 5
Figure 5. Detection of CTRP1, CTRP2, CTRP3, CTRP5 and CTRP6 in mouse serum
(A) Sera from six different strains of 8-week-old female mice (C57BL/6, BALB/c, 129SvJ, FVB, DBA and AKR) (n =3) were analysed by SDS/PAGE using antibodies specific to adiponectin or CTRPs. The molecular mass in kDa is indicated on the left-hand side of the gels. (B) Densitometric analysis of results presented in (A). Values are means±S.D. *P <0.05 (measured using Student’s t test) when compared with C57BL/6 mice. (C) Sera from 8-week-old male and female C57BL/6 mice (n = 3) were analysed by SDS/PAGE using antibodies specific to adiponectin or CTRPs. (D) Densitometric analysis of results presented in (C). Values are means±S.D. *P <0.05 (measured using Student’s t test) between male and female. (E) Sera from adiponectin wild-type (+/+), heterozygous (+/−) and homozygous null (−/−) male mice (on C57BL/6 background) were analysed by SDS/PAGE using antibodies specific to adiponectin, CTRP1, CTRP2, CTRP3 and CTRP6. (F) Densitometric analysis of results presented in (E). Values are means±S.D. *P <0.05 (measured using Student’s t test) between adiponectin-null (−/−) and wild-type (+/+; WT) mice.
Figure 6
Figure 6. CTRP1, CTRP2, CTRP3, CTRP5, CTRP6 and CTRP10 proteins are secreted in multiple oligomeric forms
(A) Gel-filtration chromatographic analyses of FLAG-tagged adiponectin and CTRPs. Fractions 10–27 were analysed by immunoblot analyses using an anti-FLAG antibody. Arrows with the molecular mass markers of 669, 440, 232 and 158 kDa correspond to the peak elution fraction of molecular standards thyroglobulin, ferritin, catalase and aldolase respectively. FPLC fractions 16–17, 18–19 and 20–23 that correspond to adiponectin trimers, hexamers and HMW oligomers respectively are indicated along the top of the Figure. (B) Gel-filtration analyses of serum derived from an 8-week-old C57BL/6 female mouse. Fractions 10–27 were analysed by immunoblot analyses using CTRP-specific antibodies. (C) A schematic diagram of adiponectin, CTRP1, CTRP3, CTRP5, CTRP6 and CTRP10. The light grey box represents the signal peptide, the dark grey box represents the N-terminal region, the white box represents the collagen domain with the number of Gly-X-Y repeats indicated, and the black box represents the globular C1q domain. Light grey circles represent cysteine residues found within the globular domains. Black circles represent cysteine residues found in the N-terminus. Numbers in the right-hand column refer to the position of the cysteine residues (indicated by black circles) that were mutated to alanine. (D) Gel-filtration analyses of FLAG-tagged adiponectinΔCys, CTRP1ΔCys, CTRP3ΔCys, CTRP5ΔCys, CTRP6ΔCys and CTRP10ΔCys proteins. Fractions 10–27 were analysed by immunoblot analyses using an anti-FLAG antibody.
Figure 7
Figure 7. Formation of hetero-oligomers between different CTRPs
(A–D) FLAG- and HA-tagged adiponectin and CTRPs were co-expressed in different combinations and the supernatants were subjected to co-immunoprecipitations using an anti-FLAG affinity gel and immunoblotted with an anti-HA antibody (top panel). The middle and bottom panels indicate the presence of FLAG- and HA-tagged input proteins in the supernatants. The molecular mass in kDa is indicated on the left-hand side of each gel. IP, immunoprecipitation; IB, immunoblot. (E) Summary of 72 co-immunoprecipitation results (from A–D; Supplementary Figure S3 at http://www.BiochemJ.org/bj/416/bj4160161add.htm). Grey boxes represent homo-oligomerization of adiponectin and each of the CTRPs. Black boxes represent hetero-oligomerization between secreted adiponectin/CTRP2, adiponectin/CTRP9, CTRP1/CTRP6 and CTRP2/CTRP7.
Figure 8
Figure 8. CTRP1/CTRP6, CTRP2/CTRP7 and CTRP2/adiponectin hetero-oligomers formed during biosynthesis and do not involve their N-terminal cysteine residues
(A–C) FLAG- and HA-tagged adiponectin, CTRP1, CTRP2, CTRP6 and CTRP7 were expressed individually or in combination and the supernatants were subjected to co-immunoprecipitations. For the mixing experiments, individually expressed adiponectin–FLAG and CTRP2–HA, CTRP7–FLAG and CTRP2–HA, and CTRP1–FLAG and CTRP6–HA were mixed for 4 h prior to co-immunoprecipitation with an anti-FLAG affinity gel followed by immunoblotting with an anti-HA antibody (top panels). The middle and bottom panels indicate the presence of FLAG- and HA-tagged input proteins in the supernatants. (D–F) FLAG- and HA-tagged adiponectin, CTRP1, CTRP2, CTRP6 and CTRP7 that lack their N-terminal cysteine residues (ΔCys, refer to the schematic diagram in Figure 6C) were expressed individually or in combination, and the supernatants were subjected to co-immunoprecipitations using an anti-FLAG affinity gel followed by immunoblotting with an anti-HA antibody (top panels). The middle and bottom panels are immunoblots that show the presence of FLAG- and HA-tagged input proteins in the supernatants. The molecular mass in kDa is indicated on the left-hand side of each gel. IP, immunoprecipitation; IB, immunoblot.
Figure 9
Figure 9. Adiponectin/CTRP2 and CTRP1/CTRP6 form heterotrimers
Gel-filtration chromatographic analyses of co-expressed adiponectin–FLAG/CTRP2–HA (A) or CTRP1–FLAG/CTRP6–HA (B). Fractions 10–27 were analysed by immunoblot analysis using an anti-FLAG or an anti-HA antibody. Fractions 10–27 were subjected to co-immunoprecipitations using an anti-FLAG affinity gel and immunoblotted with an anti-HA antibody (top panel). FPLC fractions 16–17, 18–19 and 20–23 that correspond to adiponectin trimers, hexamers and HMW oligomers respectively are indicated across the top of the Figure. IP, immunoprecipitation; IB, immunoblot.
Figure 10
Figure 10. Recombinant CTRP1 activates Akt and p44/42 MAPK signaling pathways in C2C12 myotubes
(A and B) Differentiated C2C12 myotubes were treated with control buffer or 4 μg/ml recombinant CTRP1 for 15 min. Western blot analysis were carried out on cleared cell lysates using antibodies specific to phospho-Akt (Thr308), total Akt, phospho-p44/42 MAPK (Thr202/Tyr204) and total p44/42 MAPK. The ratios of phospho to total proteins were quantified. Results shown are the fold difference between control buffer (set to a value of 1) compared with recombinant-CTRP1-treated myotubes. All experiments were performed in triplicate and similar results were obtained in two independent experiments. Values are means±S.D. *P <0.05 (measured using Student’s t test) between control buffer and CTRP1-treated myotubes.
Figure 11
Figure 11. Recombinant CTRP1 reduces blood glucose in mice
(A) Representative Coomassie-Blue-stained gel of purified CTRP1–FLAG. (B and C) Different batches of recombinant CTRP1 were used in separate in vivo studies. Approx. 2 μg of recombinant CTRP1/g of body weight or the equivalent volume of control buffer [20 mM Hepes (pH 8) and 135 mM NaCl] were injected into 8–10-week-old C57BL/6 mice (n =9–17). Blood glucose levels were measured prior to protein injection (0 h) and at 2, 4, 5 and 6 h post-injection. Values are means±S.D. *P <0.05 and **P <0.005 (measured using Student’s t test) between mice injected with control buffer and mice injected with recombinant CTRP1.

Comment in

References

    1. Trujillo ME, Scherer PE. Adipose tissue-derived factors: impact on health and disease. Endocrin. Rev. 2006;27:762–778. - PubMed
    1. Ahima RS, Qi Y, Singhal NS, Jackson MB, Scherer PE. Brain adipocytokine action and metabolic regulation. Diabetes. 2006;55(Suppl. 2):S145–S154. - PubMed
    1. Scherer PE, Williams S, Fogliano M, Baldini G, Lodish HF. A novel serum protein similar to C1q, produced exclusively in adipocytes. J. Biol. Chem. 1995;270:26746–26749. - PubMed
    1. Hu E, Liang P, Spiegelman BM. AdipoQ is a novel adipose-specific gene dysregulated in obesity. J. Biol. Chem. 1996;271:10697–10703. - PubMed
    1. Maeda K, Okubo K, Shimomura I, Funahashi T, Matsuzawa Y, Matsubara K. cDNA cloning and expression of a novel adipose specific collagen-like factor, apM1 (AdiPose Most abundant Gene transcript 1) . Biochem. Biophys. Res. Commun. 1996;221:286–289. - PubMed

Publication types

MeSH terms