

Hospital quality, efficiency, and input slack differentials
- PMID: 18783457
- PMCID: PMC2654161
- DOI: 10.1111/j.1475-6773.2008.00893.x
Hospital quality, efficiency, and input slack differentials
Abstract
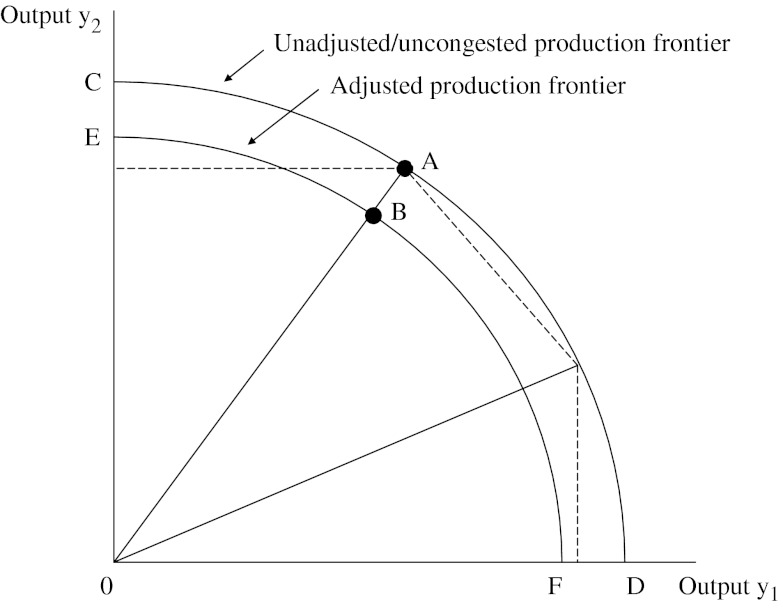
Objective: To use an advance in data envelopment analysis (DEA) called congestion analysis to assess the trade-offs between quality and efficiency in U.S. hospitals.
Study setting: Urban U.S. hospitals in 34 states operating in 2004.
Study design and data collection: Input and output data from 1,377 urban hospitals were taken from the American Hospital Association Annual Survey and the Medicare Cost Reports. Nurse-sensitive measures of quality came from the application of the Patient Safety Indicator (PSI) module of the Agency for Healthcare Research and Quality (AHRQ) Quality Indicator software to State Inpatient Databases (SID) provided by the Healthcare Cost and Utilization Project (HCUP).
Data analysis: In the first step of the study, hospitals' relative output-based efficiency was determined in order to obtain a measure of congestion (i.e., the productivity loss due to the occurrence of patient safety events). The outputs were adjusted to account for this productivity loss, and a second DEA was performed to obtain input slack values. Differences in slack values between unadjusted and adjusted outputs were used to measure either relative inefficiency or a need for quality improvement.
Principal findings: Overall, the hospitals in our sample could increase the total amount of outputs produced by an average of 26 percent by eliminating inefficiency. About 3 percent of this inefficiency can be attributed to congestion. Analysis of subsamples showed that teaching hospitals experienced no congestion loss. We found that quality of care could be improved by increasing the number of labor inputs in low-quality hospitals, whereas high-quality hospitals tended to have slack on personnel.
Conclusions: Results suggest that reallocation of resources could increase the relative quality among hospitals in our sample. Further, higher quality in some dimensions of care need not be achieved as a result of higher costs or through reduced access to health care.
Figures
Similar articles
-
Measuring hospital inefficiency: the effects of controlling for quality and patient burden of illness.Health Serv Res. 2008 Dec;43(6):1992-2013. doi: 10.1111/j.1475-6773.2008.00892.x. Epub 2008 Sep 8. Health Serv Res. 2008. PMID: 18783458 Free PMC article.
-
Testing the hospital value proposition: an empirical analysis of efficiency and quality.Health Care Manage Rev. 2008 Oct-Dec;33(4):341-9. doi: 10.1097/01.HCM.0000318770.82642.c6. Health Care Manage Rev. 2008. PMID: 18815499
-
Benchmarking urban acute care hospitals: efficiency and quality perspectives.Health Care Manage Rev. 2013 Apr-Jun;38(2):137-45. doi: 10.1097/HMR.0b013e3182527a4c. Health Care Manage Rev. 2013. PMID: 22469911
-
Performance of US teaching hospitals: a panel analysis of cost inefficiency.Health Care Manag Sci. 2004 Feb;7(1):7-16. doi: 10.1023/b:hcms.0000005393.24012.1c. Health Care Manag Sci. 2004. PMID: 14977089 Review.
-
The use of Data Envelopment Analysis (DEA) in healthcare with a focus on hospitals.Health Care Manag Sci. 2019 Jun;22(2):245-286. doi: 10.1007/s10729-018-9436-8. Epub 2018 Feb 24. Health Care Manag Sci. 2019. PMID: 29478088 Review.
Cited by
-
Inefficiency of public hospitals: a multistage data envelopment analysis in an Italian region.BMC Health Serv Res. 2021 Nov 27;21(1):1281. doi: 10.1186/s12913-021-07276-5. BMC Health Serv Res. 2021. PMID: 34838006 Free PMC article.
-
Assessing the relationships between hospital resources and activities: a systematic review.J Med Syst. 2014 Oct;38(10):127. doi: 10.1007/s10916-014-0127-9. Epub 2014 Aug 30. J Med Syst. 2014. PMID: 25171921
-
Improving the effectiveness of service delivery in the public healthcare sector: the case of ophthalmology services in Malaysia.BMC Health Serv Res. 2015 Aug 28;15:349. doi: 10.1186/s12913-015-1011-0. BMC Health Serv Res. 2015. PMID: 26315283 Free PMC article.
-
Evaluating the Relationship between Productivity and Quality in Emergency Departments.J Healthc Eng. 2017;2017:9626918. doi: 10.1155/2017/9626918. Epub 2017 Aug 3. J Healthc Eng. 2017. PMID: 29065673 Free PMC article.
-
Using nonparametric conditional approach to integrate quality into efficiency analysis: empirical evidence from cardiology departments.Health Care Manag Sci. 2017 Dec;20(4):565-576. doi: 10.1007/s10729-016-9372-4. Epub 2016 Jul 13. Health Care Manag Sci. 2017. PMID: 27412166
References
-
- Aaronson WE, Bernet PM, Pilyavsky A, Rosko M, Valdmanis V. East–West: Does It Make a Difference to Hospital Efficiencies in Ukraine? Health Economics. 2006;15(11):1175–86. - PubMed
-
- Balk B. Industrial Price, Quantity, and Productivity Indices: The Micro-Economic Theory and an Application. Boston: Kluwer Academic Publishers; 1998.
-
- Blegen M, Goode C, Reed L. Nurse Staffing and Patient Outcomes. Nursing Research. 1998;47:43–50. - PubMed
-
- Blegen M, Vaughan T. A Multi-Site Study of Nurse Staffing and Patient Occurrences. Nurse Economics. 1998;16:196–203. - PubMed
-
- Carey K, Burgess J. On Measuring the Hospital Cost/Quality Trade-Off. Health Economics. 1999;8:509–20. - PubMed
Publication types
MeSH terms
LinkOut - more resources
Full Text Sources
