Comparative Study
. 2008 Sep 10:5:21.
doi: 10.1186/1742-4682-5-21.

Feature context-dependency and complexity-reduction in probability landscapes for integrative genomics

Affiliations
Comparative Study

Feature context-dependency and complexity-reduction in probability landscapes for integrative genomics

Annick Lesne et al. Theor Biol Med Model. .

Abstract

Background: The question of how to integrate heterogeneous sources of biological information into a coherent framework that allows the gene regulatory code in eukaryotes to be systematically investigated is one of the major challenges faced by systems biology. Probability landscapes, which include as reference set the probabilistic representation of the genomic sequence, have been proposed as a possible approach to the systematic discovery and analysis of correlations amongst initially heterogeneous and un-relatable descriptions and genome-wide measurements. Much of the available experimental sequence and genome activity information is de facto, but not necessarily obviously, context dependent. Furthermore, the context dependency of the relevant information is itself dependent on the biological question addressed. It is hence necessary to develop a systematic way of discovering the context-dependency of functional genomics information in a flexible, question-dependent manner.

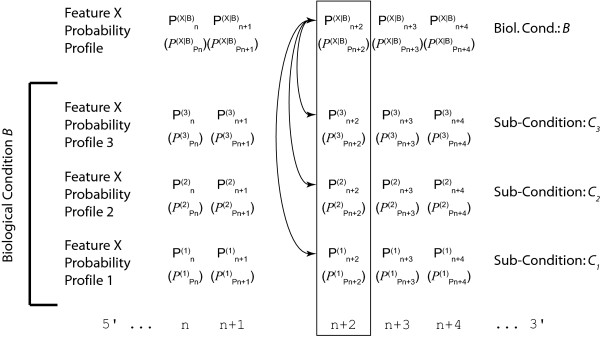
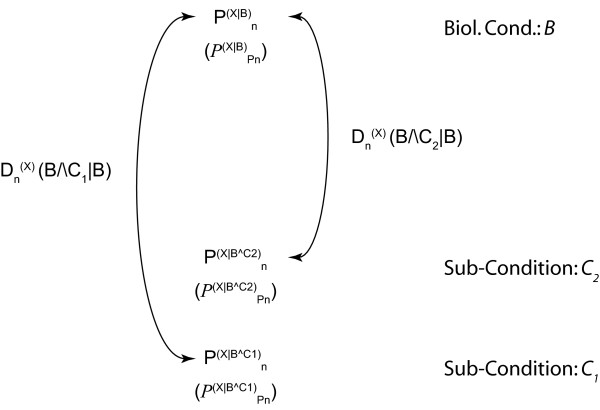
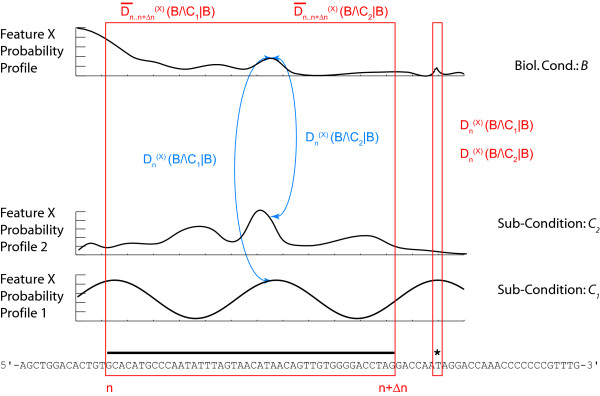
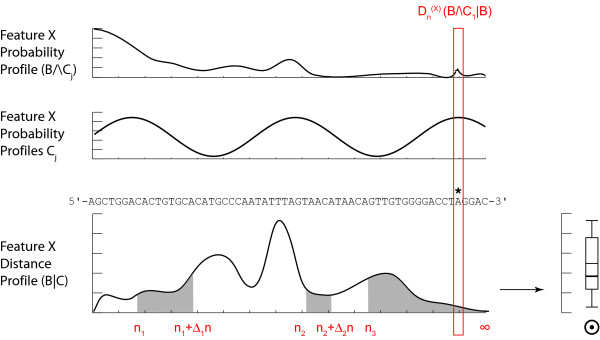
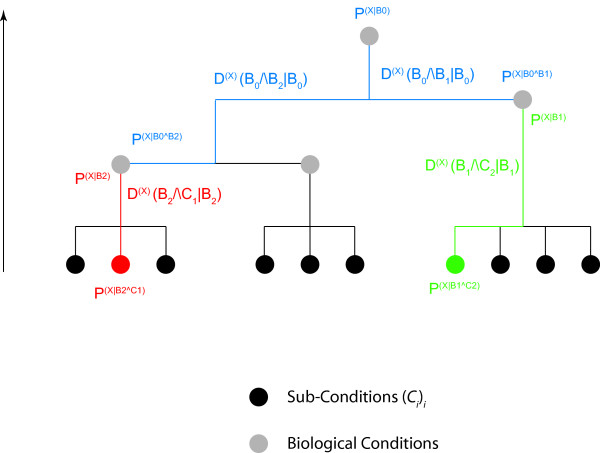
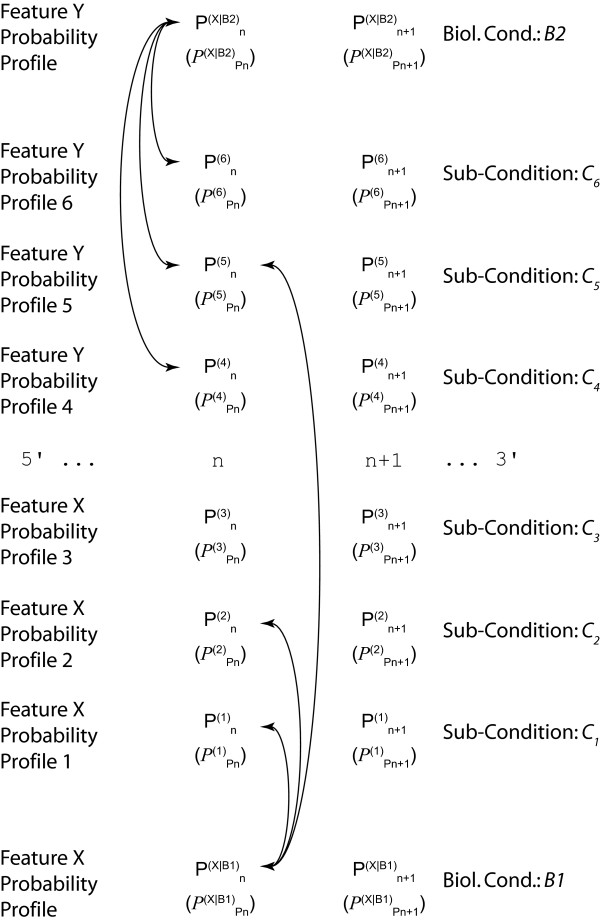
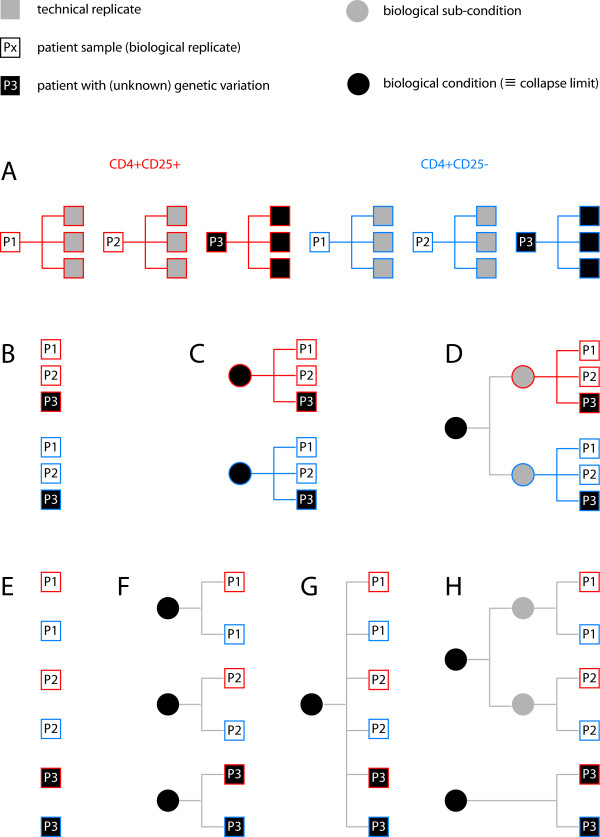
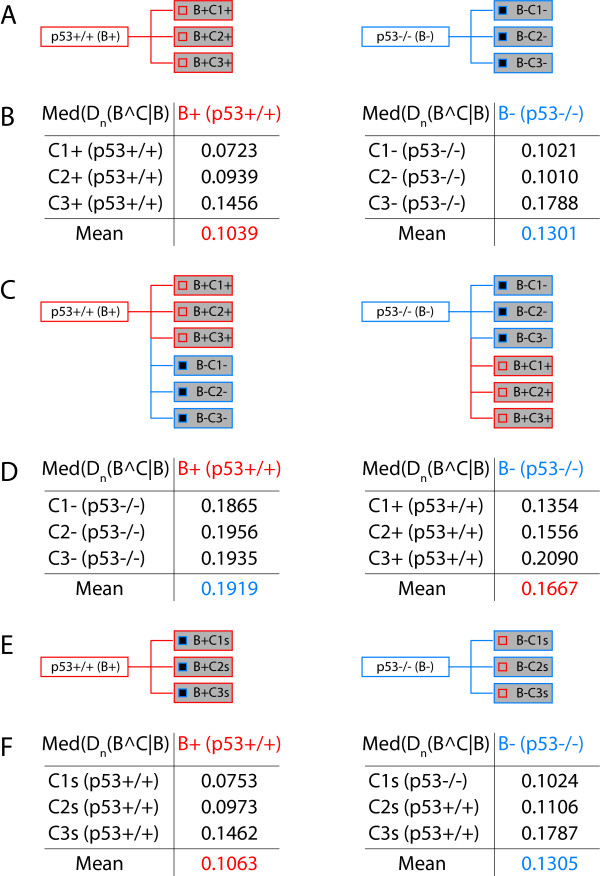
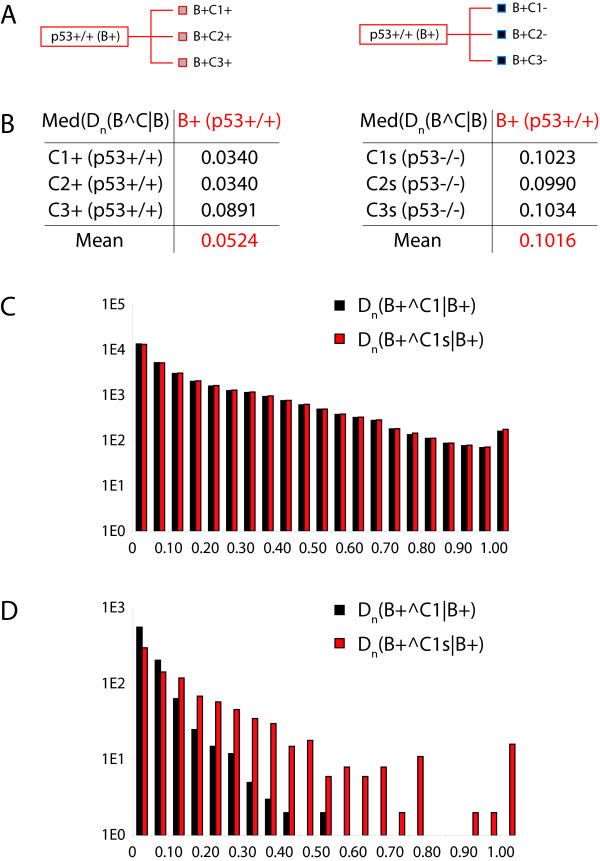
Results: We demonstrate here how feature context-dependency can be systematically investigated using probability landscapes. Furthermore, we show how different feature probability profiles can be conditionally collapsed to reduce the computational and formal, mathematical complexity of probability landscapes. Interestingly, the possibility of complexity reduction can be linked directly to the analysis of context-dependency.

Conclusion: These two advances in our understanding of the properties of probability landscapes not only simplify subsequent cross-correlation analysis in hypothesis-driven model building and testing, but also provide additional insights into the biological gene regulatory problems studied. Furthermore, insights into the nature of individual features and a classification of features according to their minimal context-dependency are achieved. The formal structure proposed contributes to a concrete and tangible basis for attempting to formulate novel mathematical structures for describing gene regulation in eukaryotes on a genome-wide scale.


Figures

Figure 1
Figure 1
Investigating context-dependency. Point-wise comparison at a given genome location (the box underlines the location n+2) of probability profiles of a feature X obtained in condition B and under various additional prescriptions Ci (i = 1, 2, 3) with the joint profile constructed from the pooled data. We have denoted in short Pn(i)=Pn(X|B,Ci) and PPn(i)=PPn(X|B,Ci) the 'probabilities of probability', i.e. the functional distributions describing the estimated variability of the distributions Pn(i). The comparison aims at determining whether the conditions Ci provide additional information on X and decrease its indeterminacy or whether they can be ignored and the analysis performed on the pooled data. Essential conditions define the 'context' of the feature X.
Figure 2
Figure 2
Defining local distance measures between probability profiles. For the validity of the methodology and an unambiguous interpretation of its results, it is essential to proceed hierarchically, and to compare distributions obtained from restricted groups of data, respectively in conditions BC1 and BC2, to the distribution obtained in the common biological condition B (pooled data). Each comparison is based on the computation of the Kullback-Leibler divergence Dn(X)(BCi|B) between the distributions Pn(X|BCi) and Pn(X|B). The significance of the comparison result depends on the variability of the distribution described by the functional distribution PPn(X|BCi).
Figure 3
Figure 3
Local and extended divergence. From the knowledge of the point-wise distances Dn(X)(BCi|B) (right box) an integrated comparison of the landscapes is performed by computing either and average distance or a cumulative distance D¯[n,n+Δn](X)(BCi|B) (left box) as a weighted sum of the distances [Dj(X)]njj+Δn. This procedure allows the extended sequence features (such as an exon for instance, black bar above nucleotide sequence) to be treated in a coherent manner. Individual nucleotide features (such as SNP data for instance), are compared directly (right box).
Figure 4
Figure 4
Integration of distance profiles. The local distance measure Dn(X)(BCi|B) is computed over the entire profile length (genome). Unlike the individual feature probability profiles, the distance profile can be integrated to give rise to a meaningful genome wide distance measure. The proper integrated distance D¯I(X) might involve several genome intervals I = [n1, n1 + Δn1] ∪ [n2, n2 + Δn2] and/or an "infinite" interval [n3, + ∞[. Obviously, other genome wide measures can be defined for the divergence such as the mean, median, sup, min, etc. Again, the divergence measure need not to be computed over all nucleotides but might be restricted to any combination of non-overlapping intervals I or individual positions n. In this way the global divergence measure computation can be restricted to particular sequence features such as coding regions.
Figure 5
Figure 5
Feature probability quality profile construction for experimental data. The set of conditions that are essential for feature X are determined hierarchically, either by considering more detailed prescriptions (additional disjoint conditions (Ci)i) corresponding to a partition of the data in constructing the conditional profiles, or in aggregating the conditions if the conditions (Ci)i have no impact on the feature. This procedure can be performed recursively. Once sub-conditions have been collapsed to a biological condition, the biological condition can be compared using the same logic to the next higher level biological condition. Please note that for reasons of simplicity we only consider the two immediately concerned levels explicitly in the notation. Imagine for instance data pertaining to the transcriptome of different types of blood cells (Ci)i. One might want to consider every cell type individually, or the red and white blood cells (B1, B2) jointly or the entire compartment (B0).
Figure 6
Figure 6
Flexible, question-driven profile collapse. The context-dependency analysis is question dependent, and hence needs to be performed for each question individually. Thereby, individual sub-conditions can be combined in a non-exclusive manner as a function of their circumstantial context.
Figure 7
Figure 7
A theoretical example of circumstantial context. (A) Let Px be a subject from whom a blood sample has been drawn. CD4+CD25+, CD4+CD25- indicate the T-cell subpopulations for which transcriptome profiles have been recorded. Subject P3 carries an unknown genetic variant with limited but functional implication for the expression of some genes. The technical variability of the experiments is sufficiently small to warrant calculation of mean expression profiles. Depending on the circumstantial context either inter-cell type comparisons can be performed in a context-dependent manner (B-D) or subject heterogeneities can be studied (E-H). In either case the divergence between features, and therefore the context-dependency, will determine to what degree the probability profiles can be collapsed upon one another. (Please refer to the discussion section for a detailed description).
Figure 8
Figure 8
A concrete example of circumstantial context analysis using transcriptome data. (A) Schematic representation of the two biological conditions (B+ p53+/+, B- p53-/-), and the three biological replicates (C1, C2, C3) from the published study [8]. The small squares inside the rectangles for the biological replicates represent the 899 probes that are statistically significantly regulated between the two biological conditions and should be considered p53 regulated genes. (B) Median of the Kullback-Leibler divergence measures for the indicated comparisons. The mean of the median of the divergence for the three comparisons is also indicated. (C) Schematic illustration of the subsequent divergence analysis, where the biological replicates of one biological condition are analyzed with respect to the other biological condition. (D) The data for the experiment illustrated in (C) are shown in a similar manner to (B). (E) The probability profiles for the 899 p53 statistically significantly regulated probes were swapped between the two biological conditions. (Compare the small squares inside the rectangles of the biological replicates). (F) Results for the experiment illustrated in (E) as in (B, D). The data should be compared to the data in (B).
Figure 9
Figure 9
Selective versus global circumstantial context analysis at the example of actual data. (A) The Kullback-Leibler divergence measures were once calculated for the 899 p53 sensitive probes in the B+ case, and once using the B- probability profiles compared to the B+ biological condition. (B) Data for (A) as in (Figure 8B, D, F). Both tables can be directly compared. (C) Histogram of the Kullback-Leibler divergence distribution over the entire set of 31710 probes analyzed in the two indicated cases. Note that "C1mix" refers to the swapping experiment as illustrated in (Figure 8E). Note also that the final bin encompasses the interval]1..+∞[. (D) Similar histogram as in (C) for the 899 probes showing significant p53 regulation (compare (A)).

Similar articles

Cited by

References

    1. Benecke A. Genomic plasticity and information processing by transcription coregulators. ComPlexUs. 2003;1:65–76. doi: 10.1159/000070463. - DOI
    1. Benecke A. Chromatin code, local non-equilibrium dynamics, and the emergence of transcription regulatory programs. Eur Phys J E. 2006;19:379–84. doi: 10.1140/epje/i2005-10068-8. - DOI - PubMed
    1. Berg J. Dynamics of gene expression and the regulatory inference problem. Eur Phys Lett. 2008;82:28010. doi: 10.1209/0295-5075/82/28010. - DOI
    1. Benecke A. Gene regulatory network inference using out of equilibrium statistical mechanics. HFSP J. 2008;2:183–8. doi: 10.2976/1.2957743. - DOI - PMC - PubMed
    1. Lesne A, Benecke A. Probability landscapes for integrative genomics. Theor Biol Med Model. 2008;5:9. doi: 10.1186/1742-4682-5-9. - DOI - PMC - PubMed

Publication types