Comparative Study
. 2008 Oct 31;383(1):62-77.
doi: 10.1016/j.jmb.2008.04.076. Epub 2008 May 7.

Crystal structure of metastasis-associated protein S100A4 in the active calcium-bound form

Affiliations
Comparative Study

Crystal structure of metastasis-associated protein S100A4 in the active calcium-bound form

Puja Pathuri et al. J Mol Biol. .

Abstract

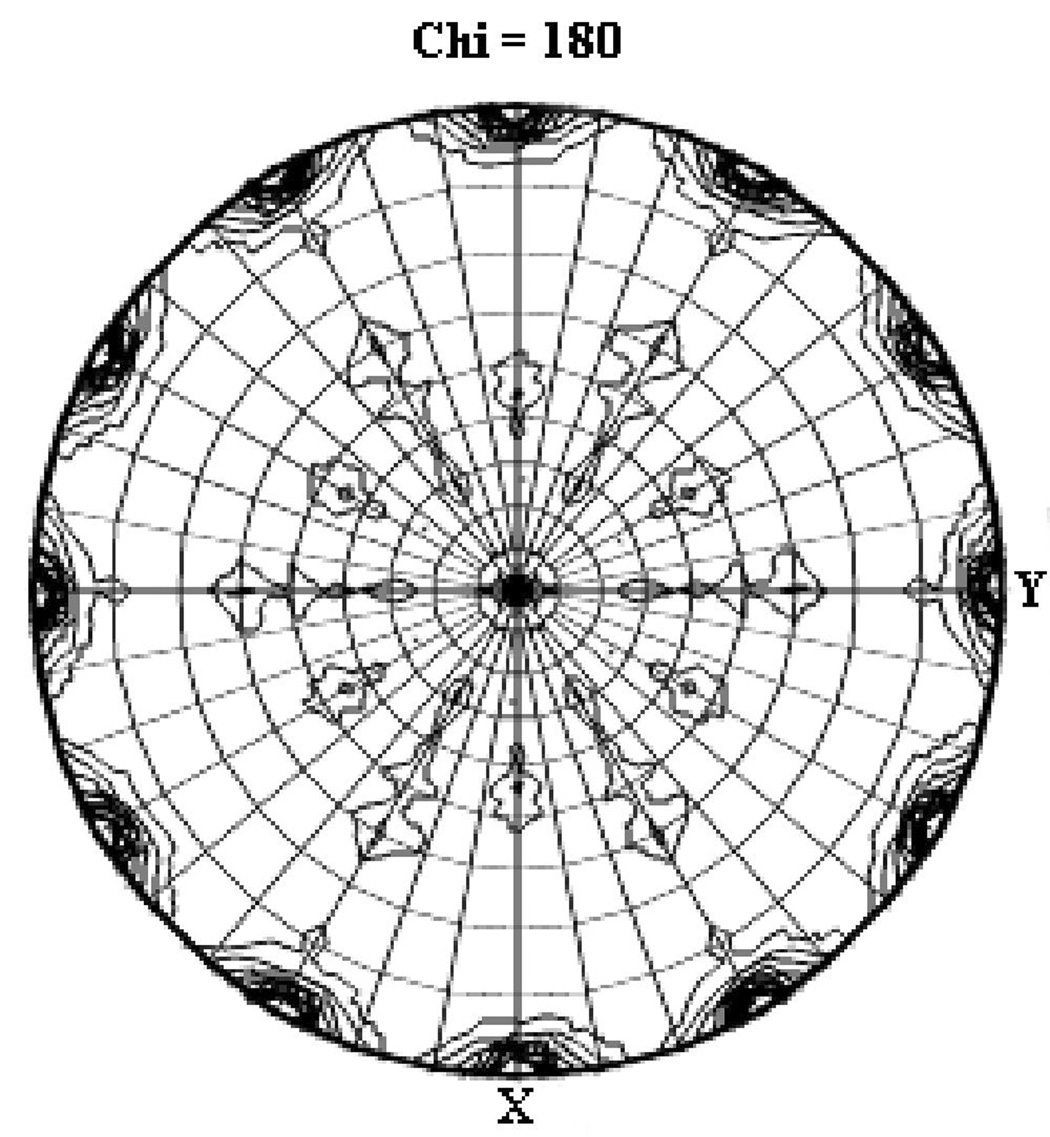
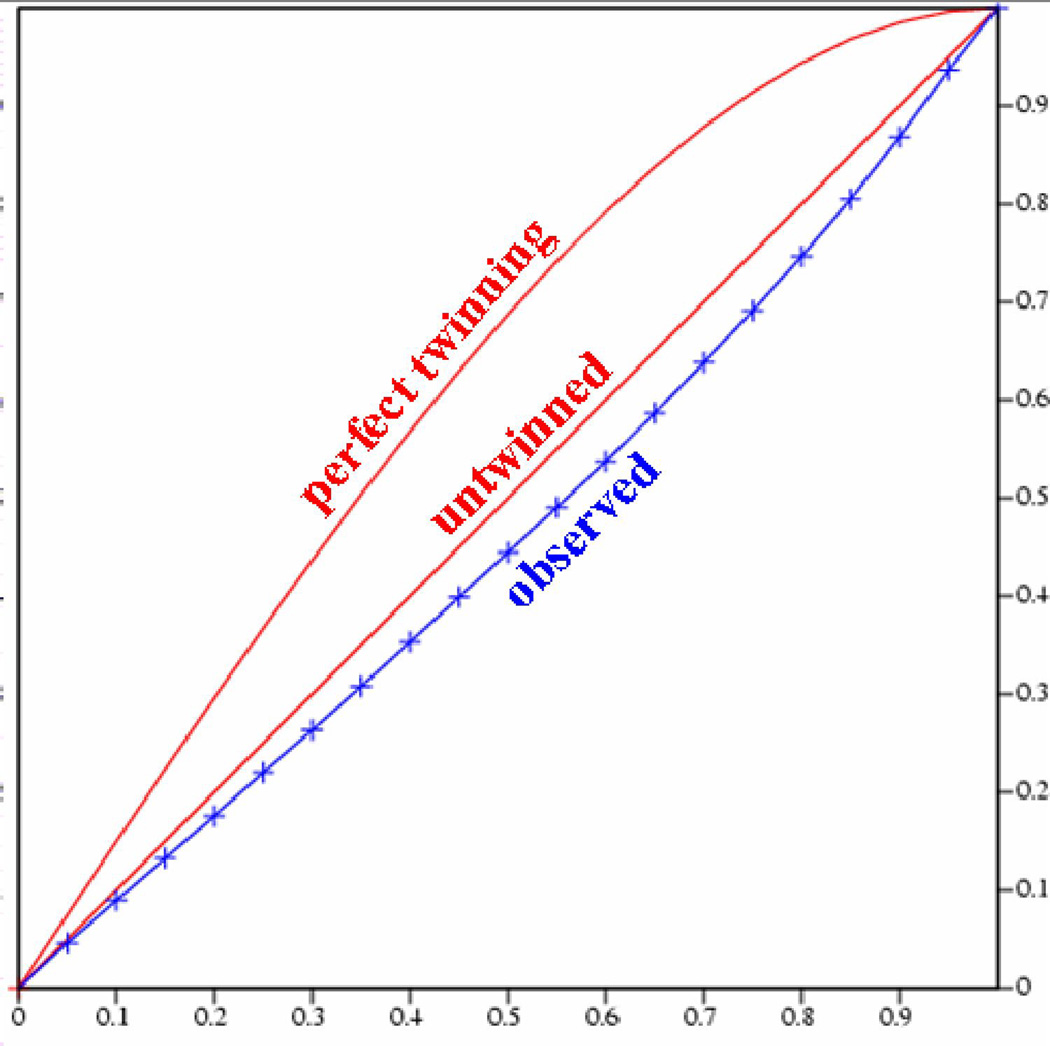
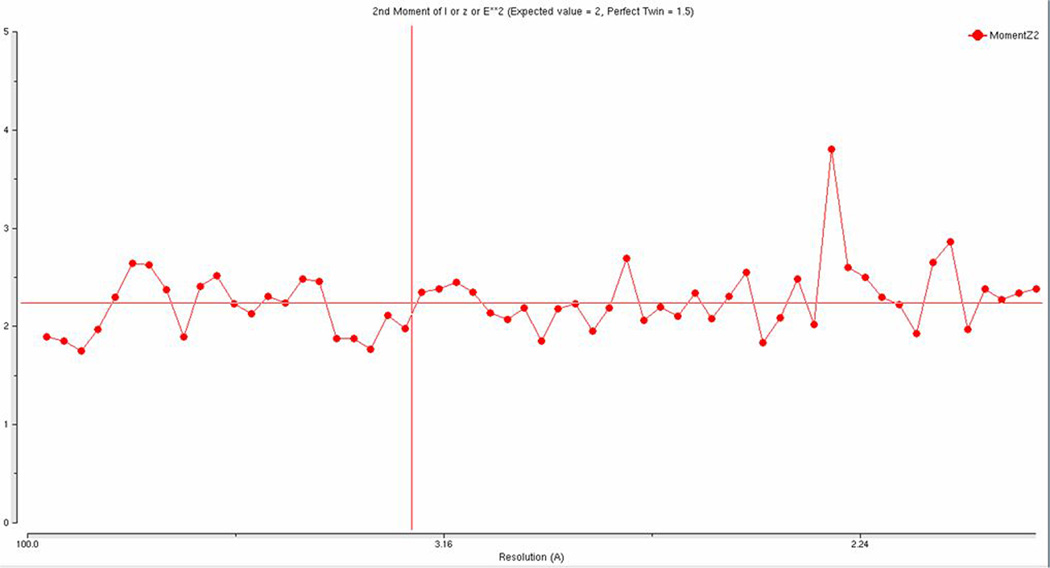
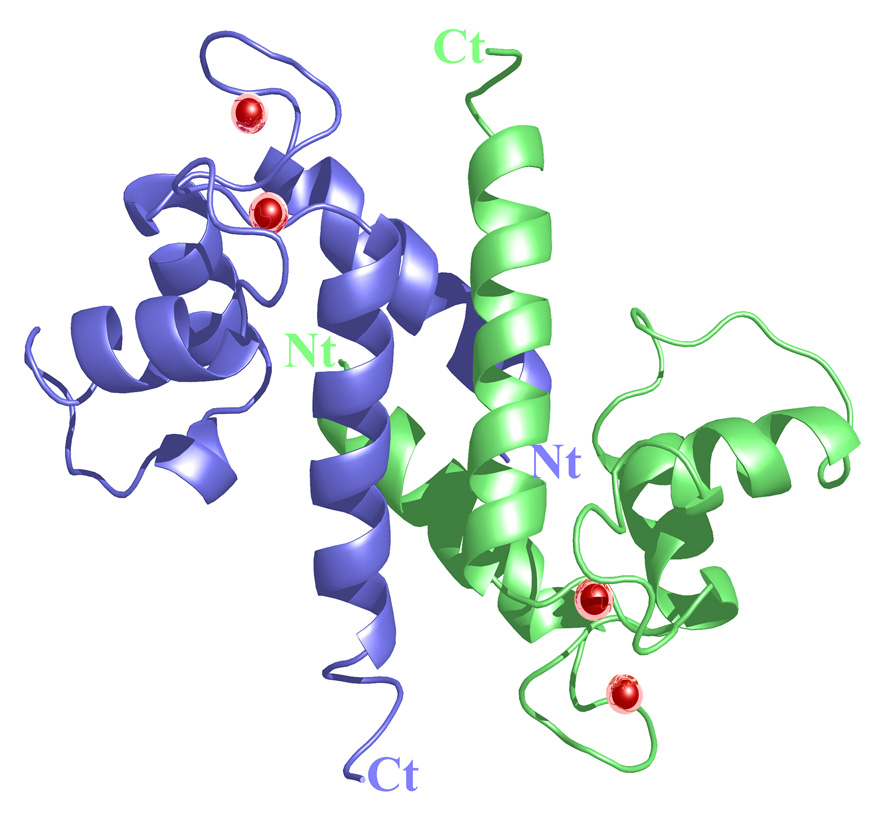
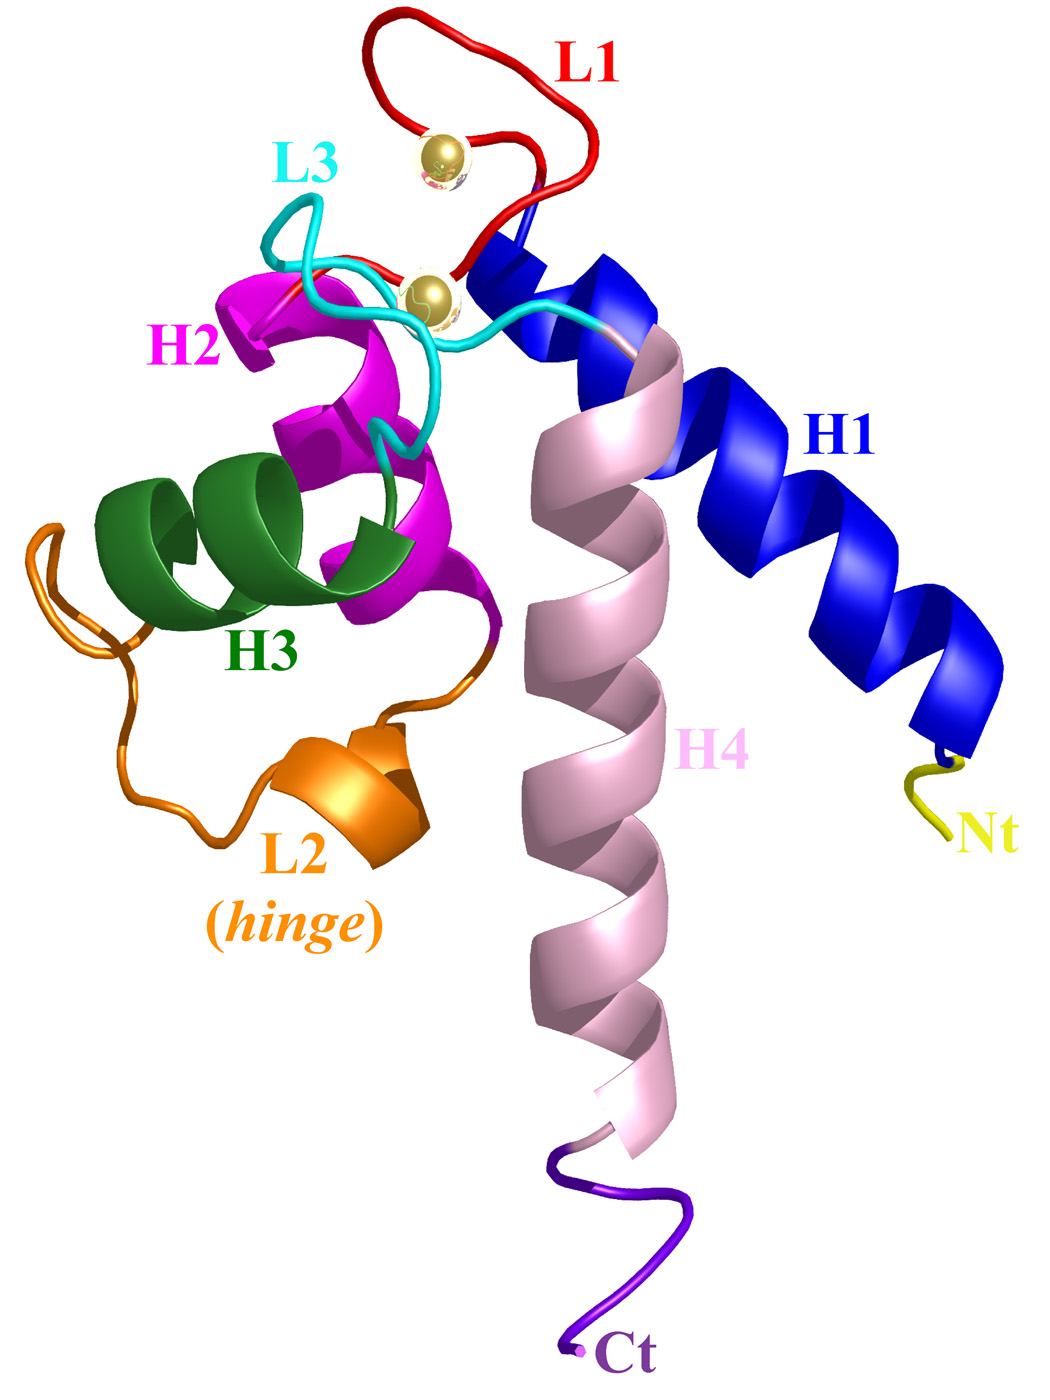
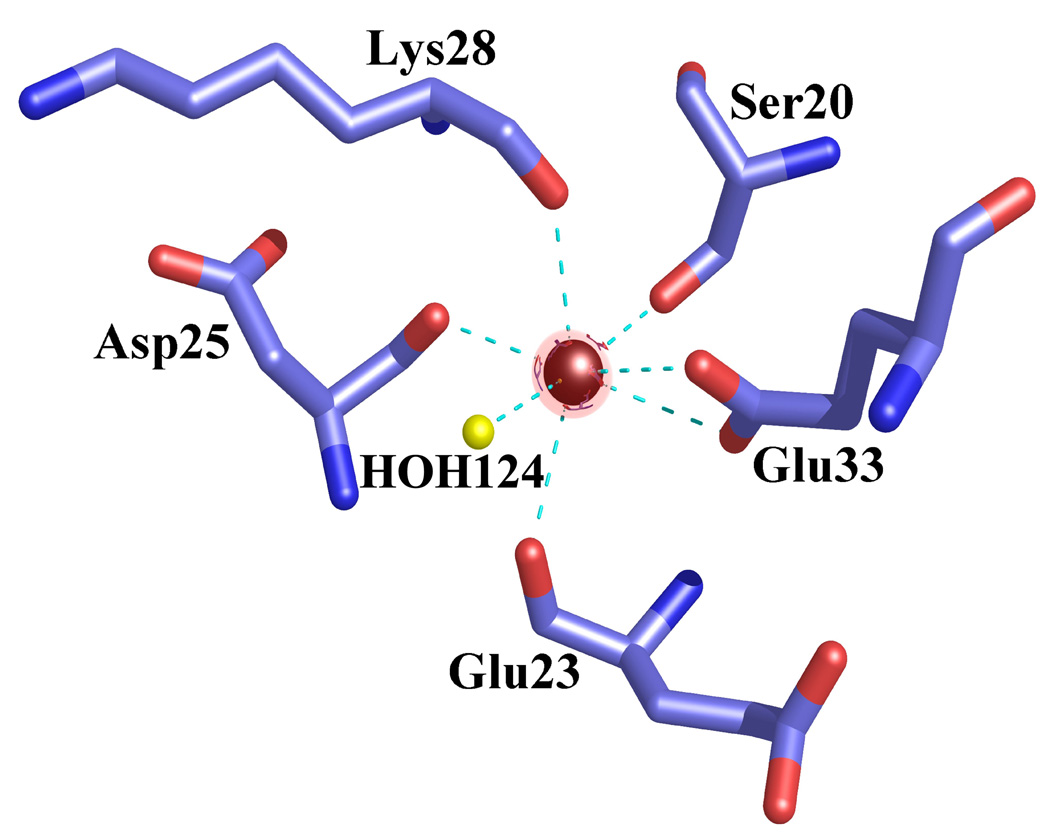
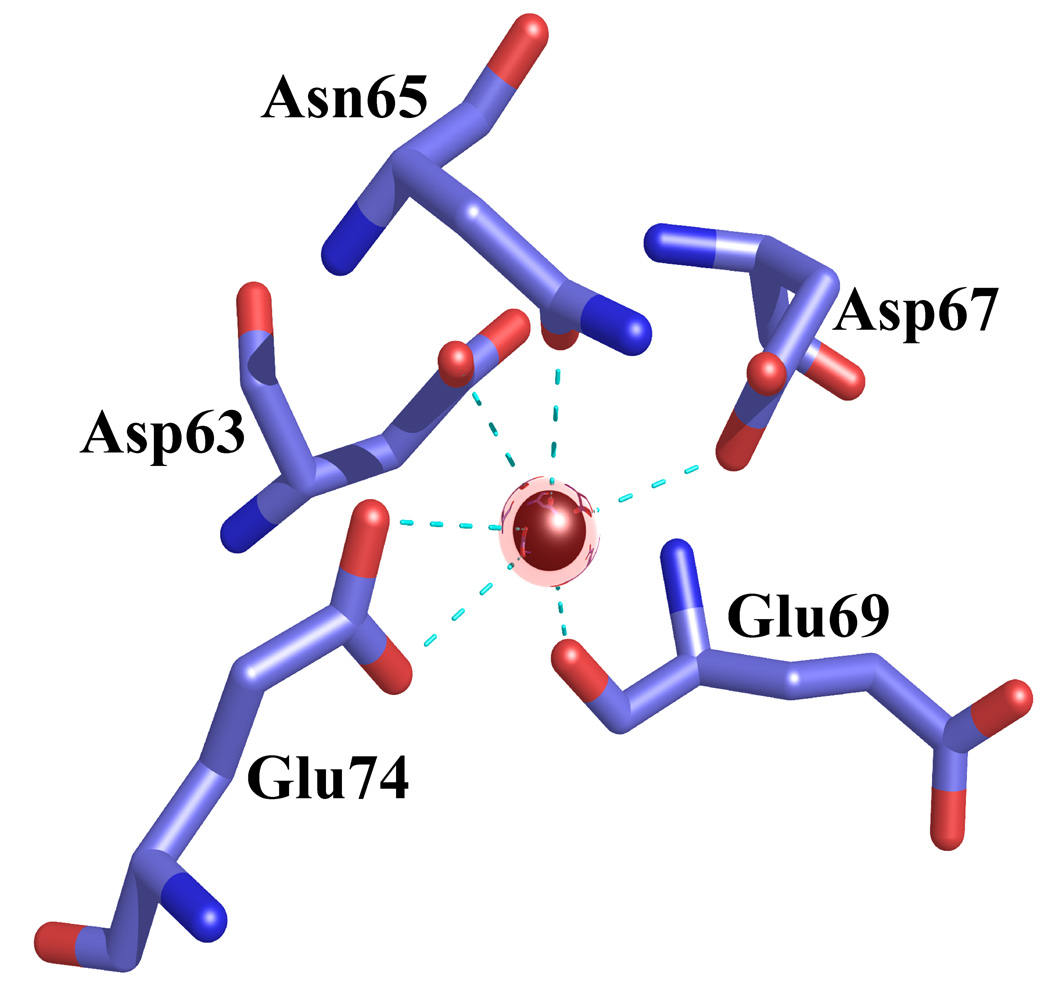
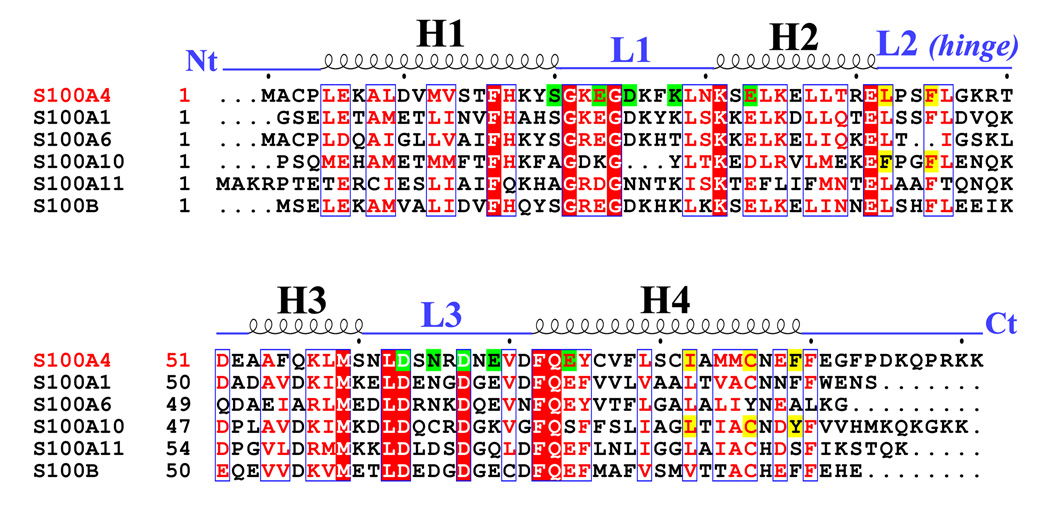
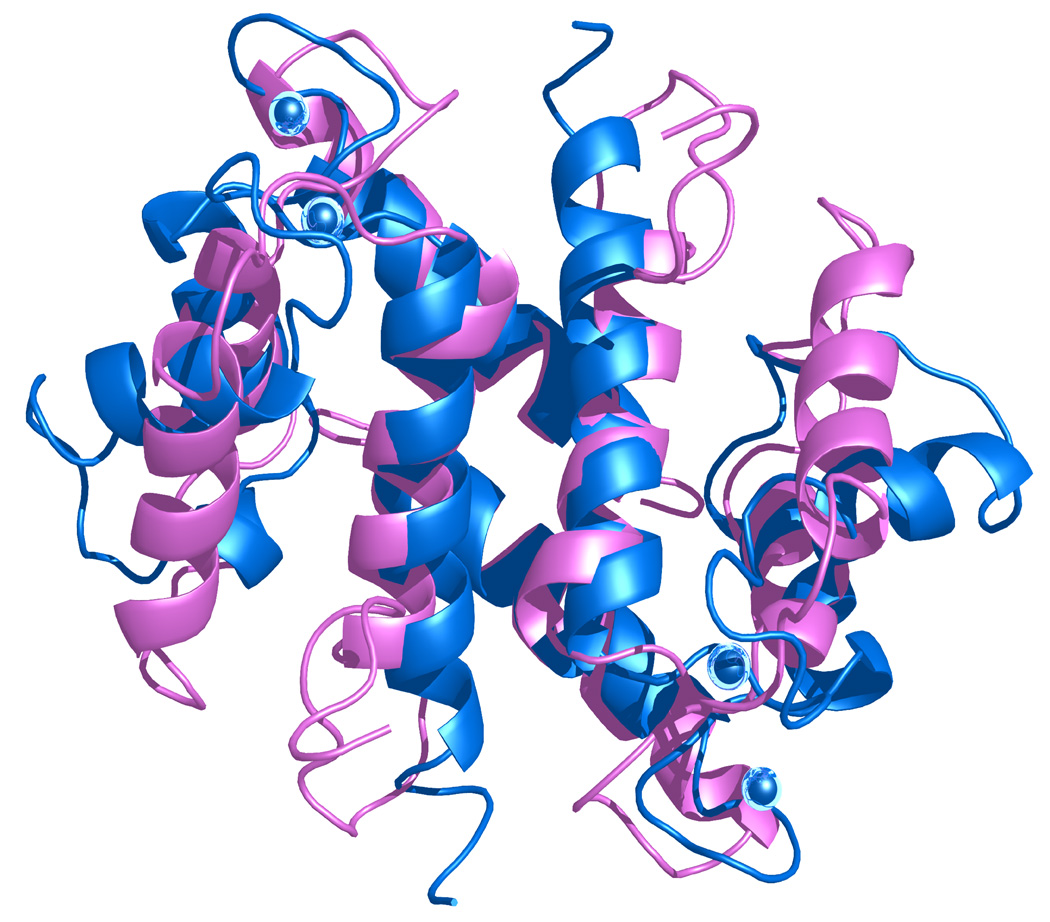
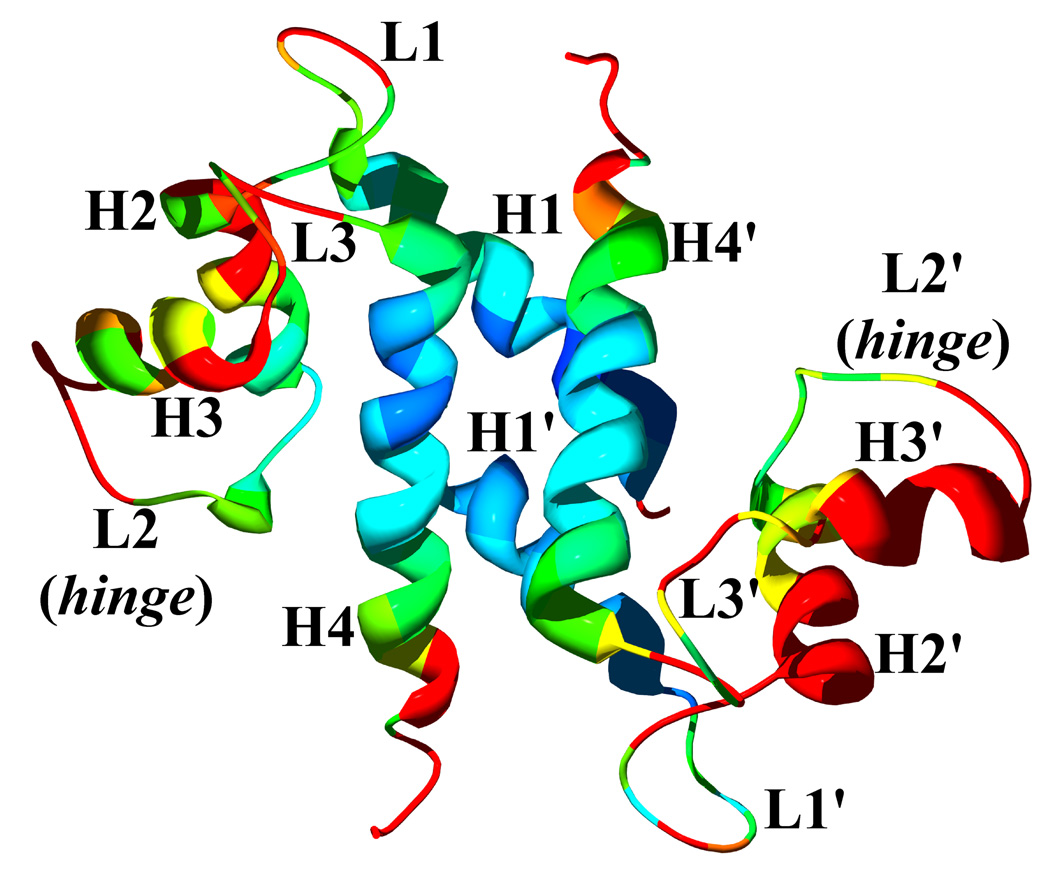
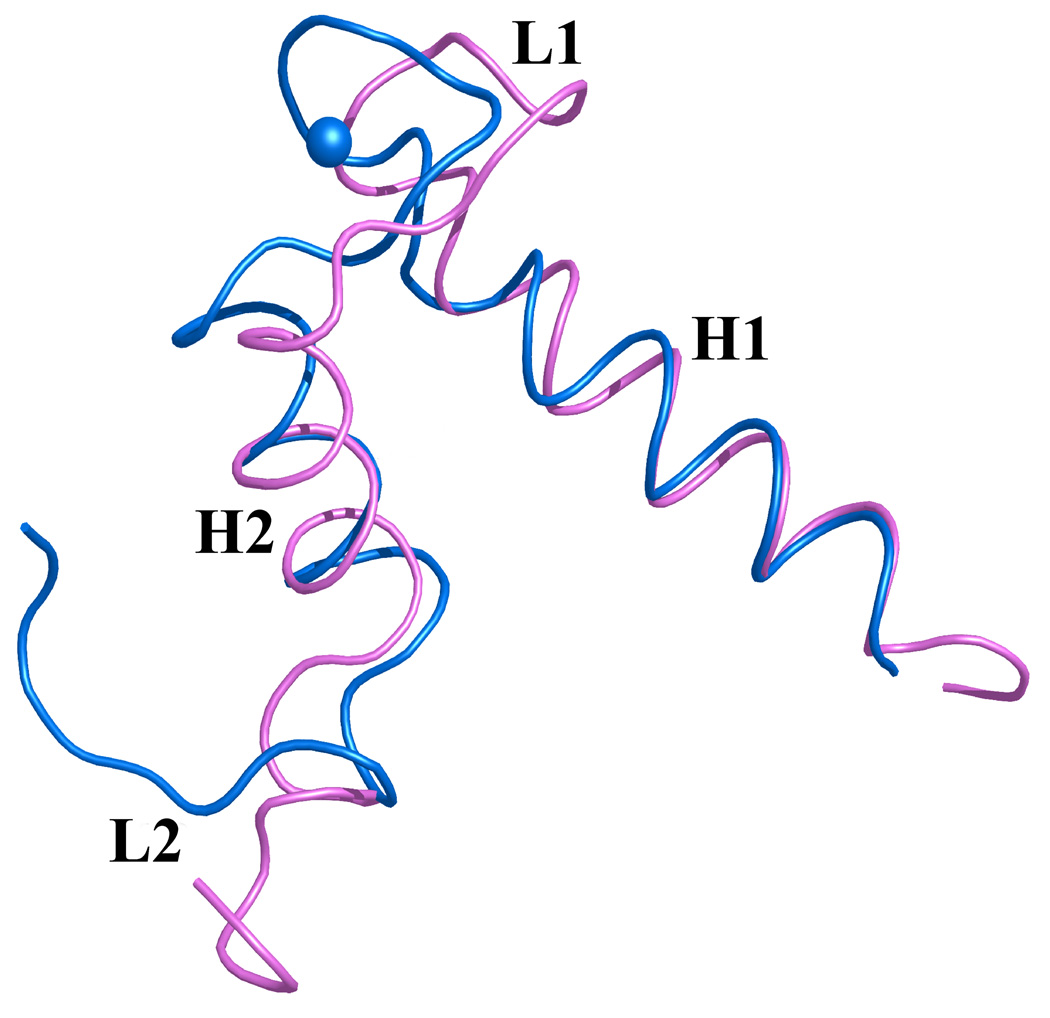
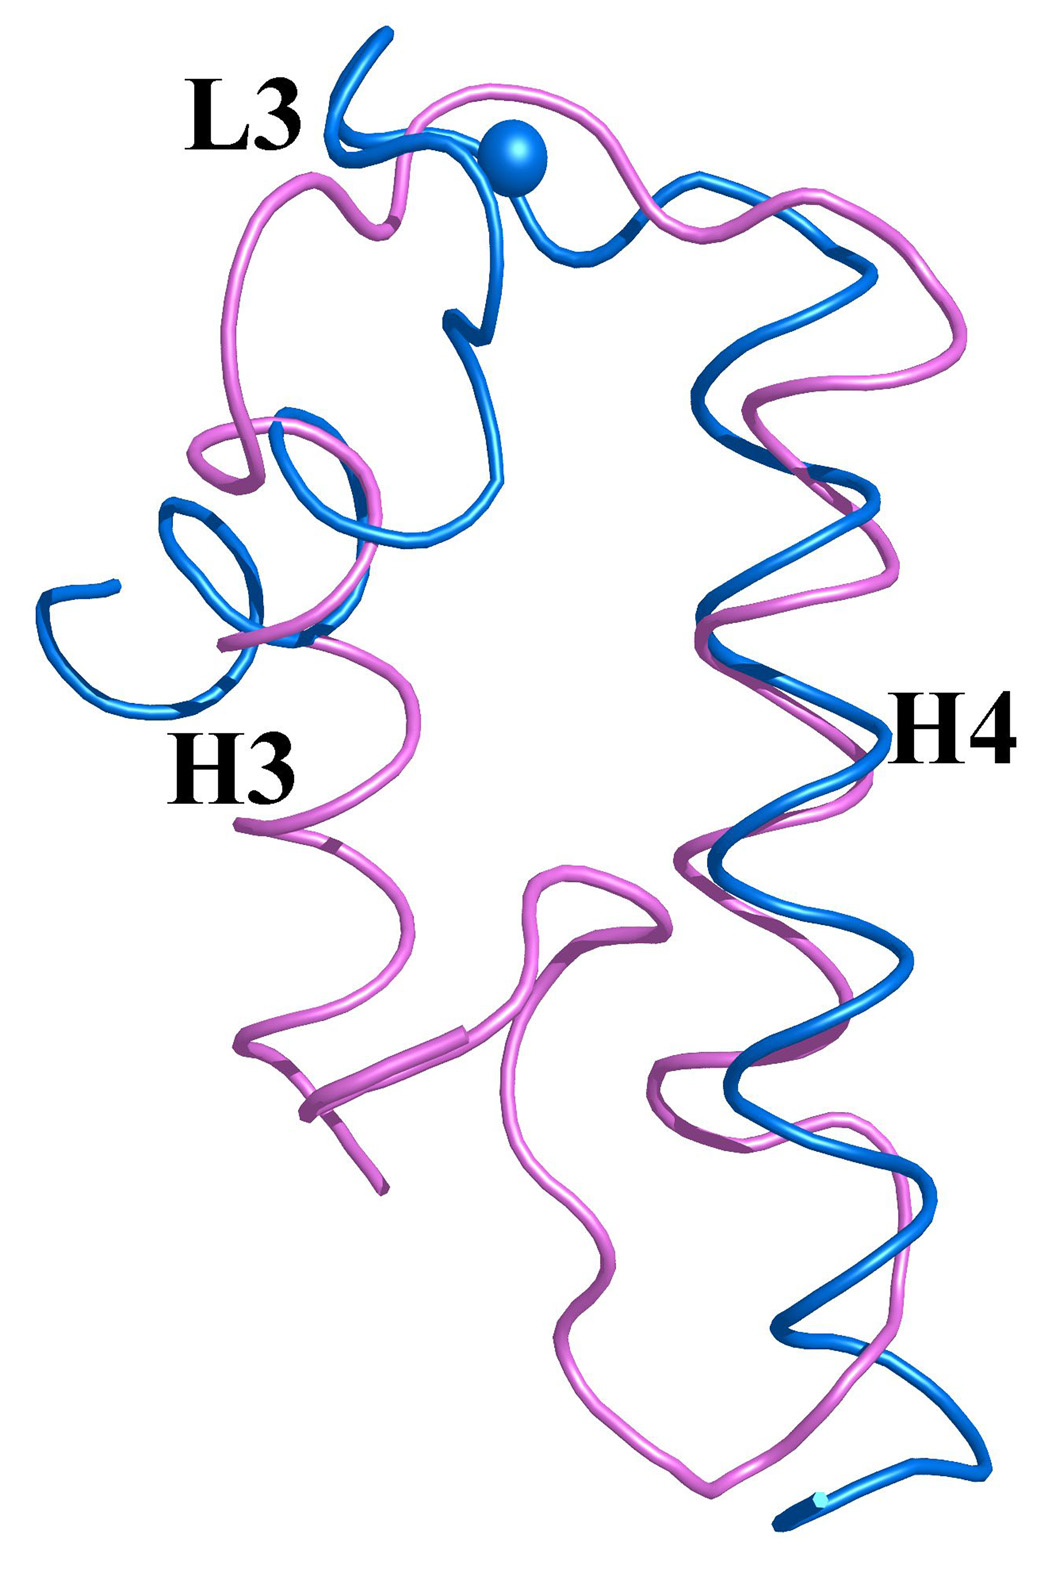
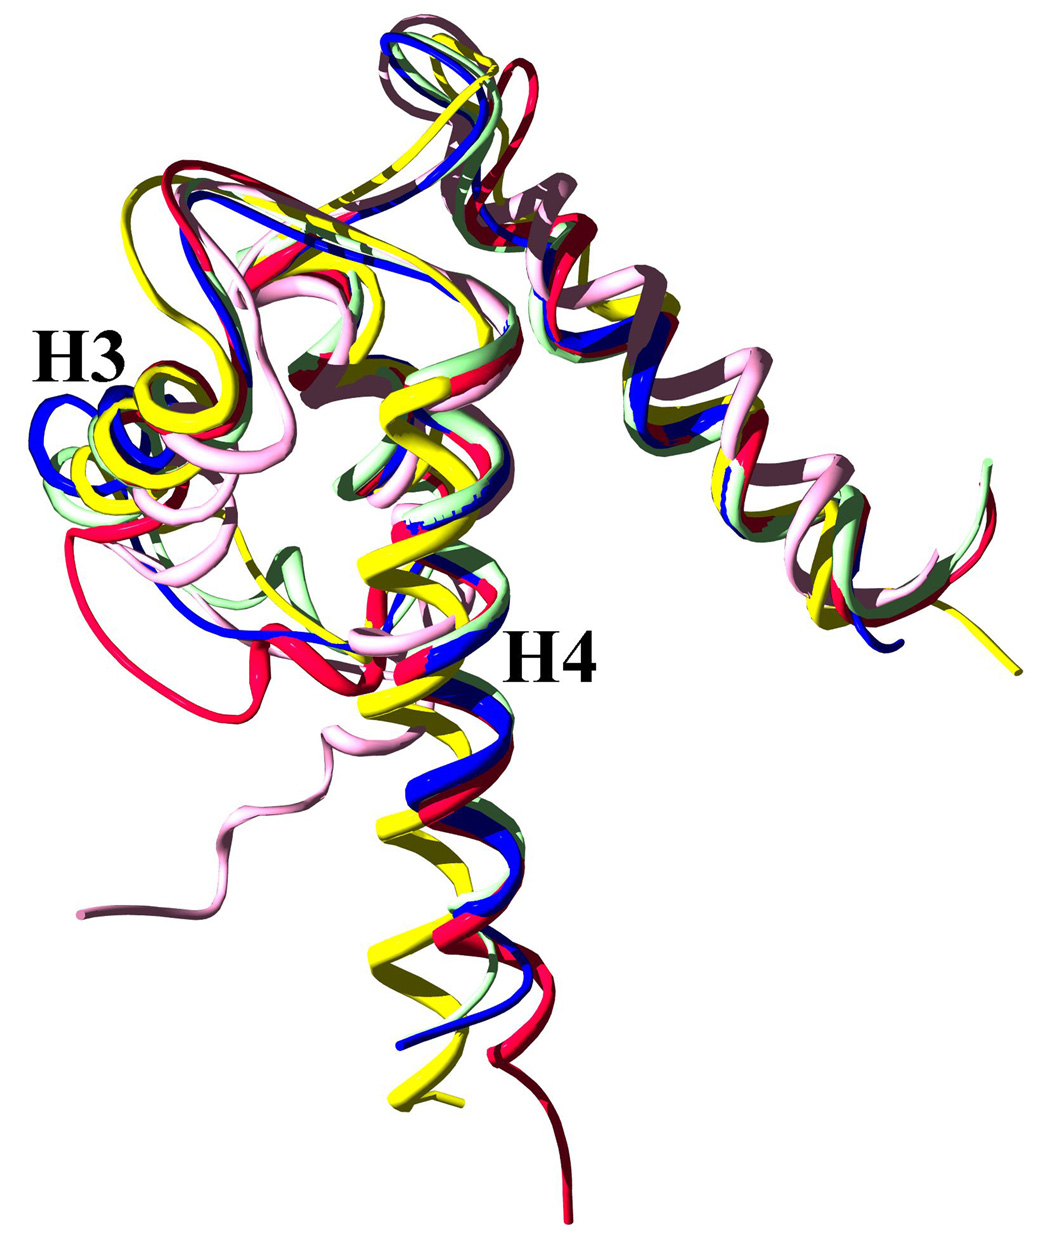
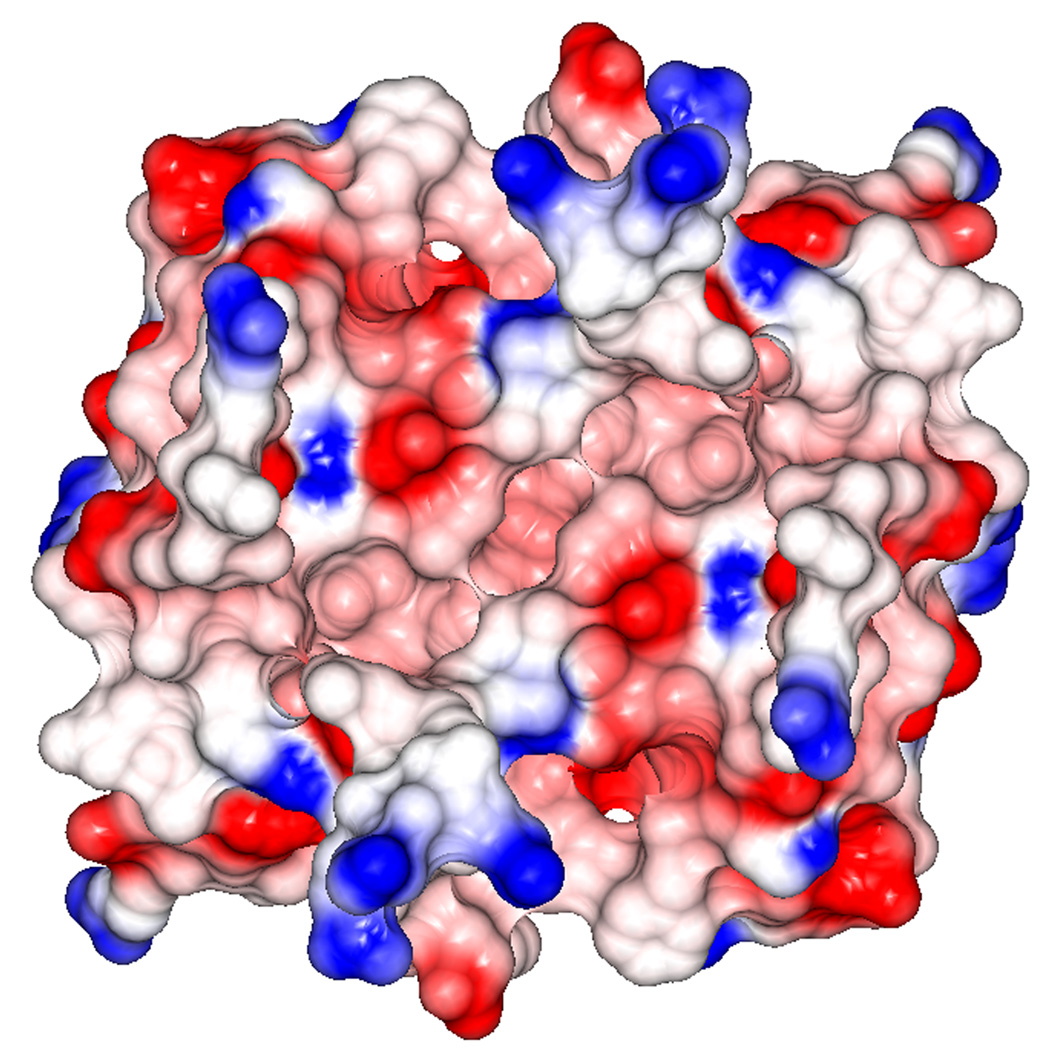
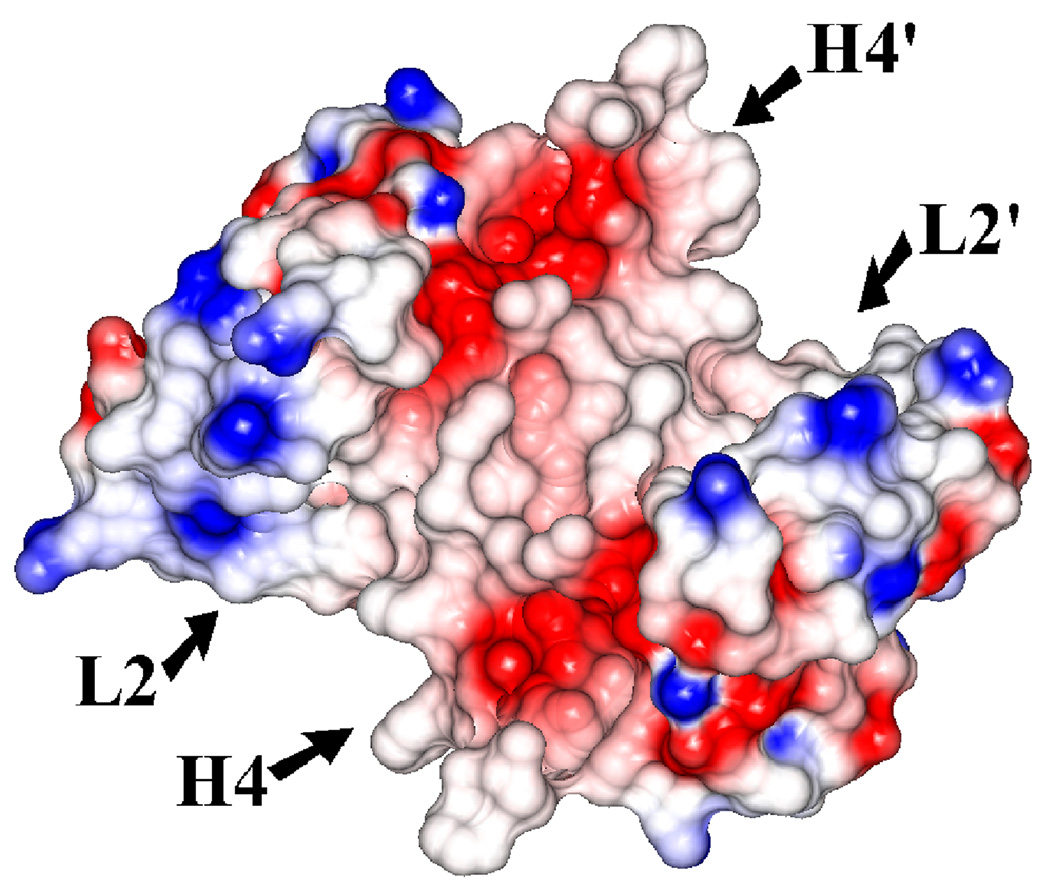
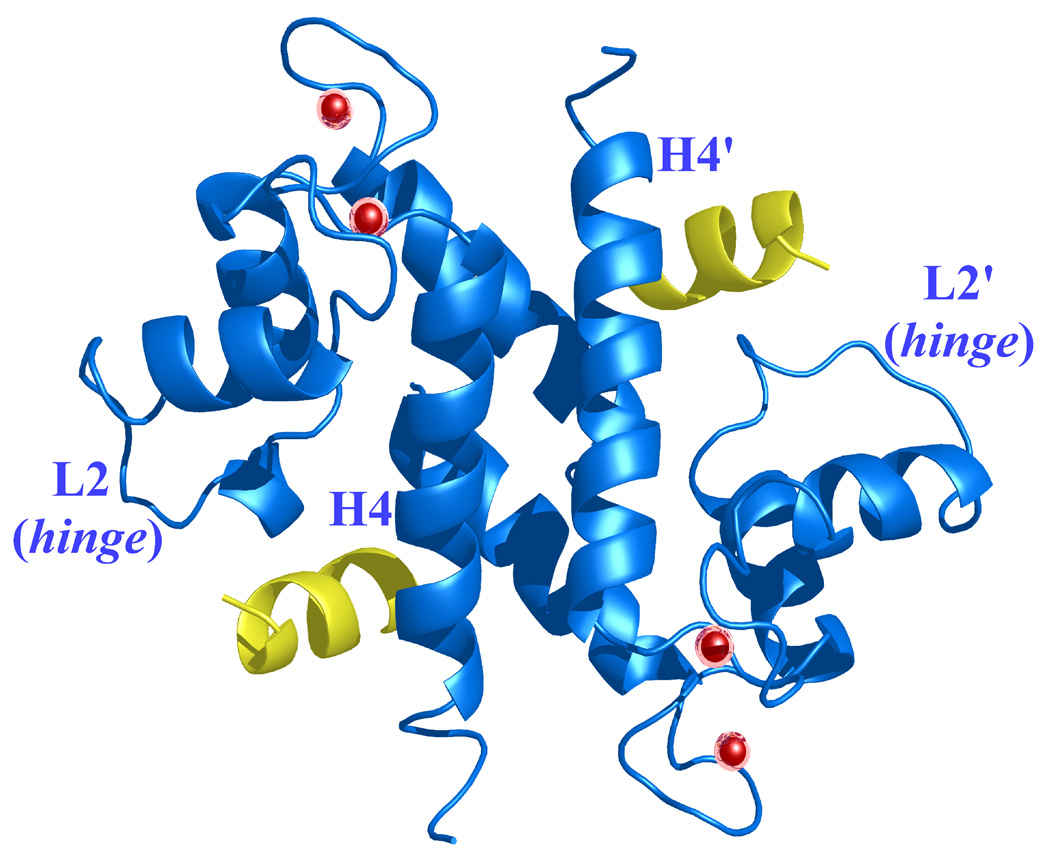
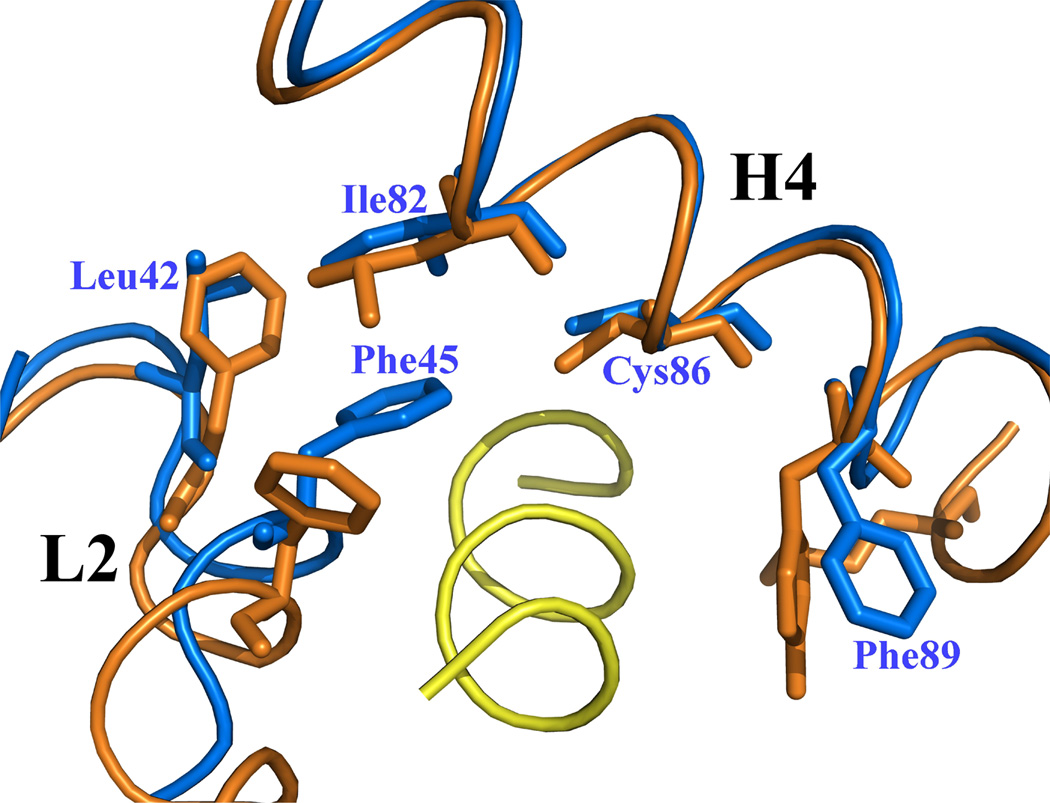
S100A4 (metastasin) is a member of the S100 family of calcium-binding proteins that is directly involved in tumorigenesis. Until recently, the only structural information available was the solution NMR structure of the inactive calcium-free form of the protein. Here we report the crystal structure of human S100A4 in the active calcium-bound state at 2.03 A resolution that was solved by molecular replacement in the space group P6(5) with two molecules in the asymmetric unit from perfectly merohedrally twinned crystals. The Ca(2+)-bound S100A4 structure reveals a large conformational change in the three-dimensional structure of the dimeric S100A4 protein upon calcium binding. This calcium-dependent conformational change opens up a hydrophobic binding pocket that is capable of binding to target proteins such as annexin A2, the tumor-suppressor protein p53 and myosin IIA. The structure of the active form of S100A4 provides insight into its interactions with its binding partners and a better understanding of its role in metastasis.


Figures

Figure 1
Figure 1. Analysis of merohedral twinning for data reduced in spacegroup P65
(a) Self-rotation function for κ = 180°. In addition to the crystallographic two-fold peak at ψ = 90°, φ = 90°, the plot shows two strong two-fold peaks every 30° in the a/b plane, which is usually an indication of a P622 spacegroup. The resolution limits are 25-2.03 Å and the Patterson vector cutoff radius is 30.0 Å. (b) Results from the twinning server (Twin Detector: Padilla-Yeates Algorithm) suggests that the crystal is not twinned. (c) The plot from the twinning analysis program TRUNCATE from CCP4 also suggests that the crystal is not twinned. The expected values of (I2)/(I)2 are 2.0 for non-twined data and 1.5 for perfectly twinned data.
Figure 2
Figure 2. Ribbon diagram of the Ca2+-bound S100A4 homodimer
Monomer A is shown in blue, monomer B is shown in green and the calcium ions are represented as red spheres. The N termini and C termini are labeled as Nt and Ct, respectively. The figure was prepared using the programs Pymol [http://pymol.sourceforge.net/] and POVRAY [http://www.povray.org/].
Figure 3
Figure 3. Ribbon representation of the Ca2+-bound S100A4 monomer
Helix H1 is shown in blue, helix H2 is shown in dark pink, helix H3 is shown in green, helix H4 is shown in light pink, loop L2 is shown in red, loop L2 (hinge) is shown in orange and loop L3 is shown in cyan. The calcium ions are represented as gold spheres, the N terminus (Nt) is shown in yellow and the C terminus (Ct) is shown in purple. The figure was prepared using the programs Pymol [http://pymol.sourceforge.net/] and POVRAY [http://www.povray.org/].
Figure 4
Figure 4. Coordination of the calcium ions in the EF-hand I and EF-hand II loops in the Ca2+-bound S100A4 structure
Calcium ions are represented as red spheres, water molecules as yellow spheres and the coordination between the calcium ion and oxygen atoms is indicated by cyan dotted lines. (a) Calcium coordination in the EF-hand I loop. The coordination distances between the calcium ion and the coordinating oxygen atoms (Ca-O) are as follows: Ca-O Ser20 2.45 Å, Ca-O Glu23 2.54 Å, Ca-O Asp25 2.22 Å, Ca-O Lys28 2.64 Å, Ca-OE1 Glu33 2.77 Å, Ca-OE2 Glu33 2.37 Å and Ca-O HOH124 2.36 Å. (b) Calcium coordination in the EF-hand II loop. The coordination distances between the calcium ion and the coordinating oxygen atoms (Ca-O) are as follows: Ca-OD1 Asp63 2.31 Å, Ca-OD1 Asn65 2.15 Å, Ca-OD1 Asp67 2.75 Å, Ca-O Glu69 2.27 Å, Ca-OE1 Glu74 2.26 Å and Ca-OE2 Glu74 2.61 Å. The figure was prepared in the molecular graphics programs Pymol [http://pymol.sourceforge.net/] and POVRAY [http://www.povray.org/].
Figure 5
Figure 5. Sequence alignment of S100A4 and S100 family members S100A1, S100A6, S100A10, S100A11 and S100B
The secondary structural elements for S100A4 are indicated above the alignment. Helices H1, H2, H3 and H4 and loop regions L1, L2 (hinge) and L3 are labeled. The N terminus and C terminus are labeled as Nt and Ct, respectively. Residues denoted as white letters on red background are strictly conserved. Residues boxed in blue and denoted in red are homologous while residues denoted in black are non-homologous in this group. Highlighted in green are residues that coordinate the calcium ions in EF-hand I (pseudo EF hand) and EF-hand II. Highlighted in yellow are residues that form hydrophobic interactions with the annexin A2 peptide in complex with S100A10 and the proposed residues that may form hydrophobic interactions with annexin A2 in complex with S100A4. The sequence alignment was created using the program CLUSTALW; and the figure was prepared with the program ESPript.
Figure 6
Figure 6. Comparison of apo (inactive) and calcium-bound (active) S100A4 structures
(a) Ribbon representation of the apo S100A4 NMR structure (blue) superimposed on the Ca2+-bound S100A4 (pink) crystal structure. Calcium ions are represented as blue spheres in the Ca2+-bound S100A4 crystal structure. (b) The Ca2+-bound S100A4 dimer colored from blue to red according to its r.m.s.d. from apo S100A4, with regions with the largest deviations depicted in red. Helices H1, H2, H3 and H4 and loop regions L1, L2 (hinge) and L3 are labeled. Superposition of the apo and Ca2+-bound structures was performed with the program Coot (Cα r.m.s.d. 1.67 Å) and the figure was prepared in the molecular graphics programs Swiss-Pdb Viewer, Pymol [http://pymol.sourceforge.net/] and POVRAY [http://www.povray.org/].
Figure 7
Figure 7. Overlay of EF-hands I and II from monomer A of S100A4 in the apo (pink) and Ca2+-bound (blue) states
Calcium ions are represented as blue spheres in the Ca2+-bound S100A4 crystal structure and helices H1, H2, H3 and H4 and loop regions L1, L2 (hinge) and L3 are labeled. (a) Superimposition of the N-terminal EF-hand (EF-hand I) and (b) the C-terminal EF-hand (EF-hand II) in the apo and Ca2+-bound states illustrating how these two regions change conformation upon calcium binding. Superposition of the apo and Ca2+-bound structures was performed with the program Coot and the figure was prepared in the molecular graphics programs Pymol [http://pymol.sourceforge.net/] and POVRAY [http://www.povray.org/].
Figure 8
Figure 8. Superposed Cα ribbon representations of five S100 proteins with bound calcium: S100A4 in blue, the S100A10 in red, S100A1 in yellow, S100A6 in mint and S100B in pink
Helices H3 and H4 are labeled to illustrate the differences between the orientations of these helices among the S100 family members. Bound calcium ions were removed for clarity. Superposition of the S100 protein structures was performed in the molecular graphics programs Swiss-Pdb Viewer and the figure was rendered with POVRAY [http://www.povray.org/].
Figure 9
Figure 9. Electrostatic surface potential representations of (a) apo S100A4 and (b) Ca2+-bound S100A4
Red, blue and white areas indicate negatively charged, positively charged and hydrophobic regions, respectively. Helices H4 and H4’ and loop regions L2 and L2’ are labeled. The electrostatic surface representation of the Ca2+-bound S100A4 structure highlights the exposure of two symmetrically hydrophobic target binding sites formed by helix H4 and loop L2, and by helix H4’ and loop L2’, which are buried in the apo S100A4 structure. The figure was prepared in the CCP4 molecular graphics program.
Figure 10
Figure 10. Ca2+-bound S100A4 structure modeled in complex with the N-terminal domain of annexin A2, based on a superimposition of the S100A10/N-terminal annexin A2 peptide complex structure on the Ca2+-bound S100A4 structure.
Helices H4 and H4’ and loop regions L2 and L2’ are labeled. (a) Ribbon representation of Ca2+-bound S100A4 (blue) homodimer with two annexin A2 peptides (yellow) bound to the target-binding regions formed by helix H4 and loop L2, and by helix H4’ and loop L2’. Calcium ions are represented as red spheres. (b) A close-up view on the overlay of the target-binding regions of Ca2+-bound S100A4 (blue) and S100A10 (orange) with the N-terminal annexin A2 peptide (yellow). The residues (orange) forming hydrophobic interactions in S100A10 with the N-terminal annexin A2 peptide are shown as sticks. Corresponding residues Leu42, Phe45, Ile82, Cys86 and Phe89 in S100A4 that may form hydrophobic interactions with the N-terminal annexin A2 peptide are labeled and shown as sticks. Superposition of the Ca2+-bound S100A4 and S100A10/N-terminal annexin A2 peptide complex structures was performed with the program Coot and the figure was prepared in the program Pymol [http://pymol.sourceforge.net/].

Similar articles

Cited by

References

    1. Schafer BW, Heizmann CW. The S100 family of EF-hand calcium-binding proteins: functions and pathology. Trends Biochem. Sci. 1996;21:134–140. - PubMed
    1. Zimmer DB, Cornwall EH, Landar A, Song W. The S100 protein family: history, function, and expression. Brain Res. Bull. 1995;37:417–429. - PubMed
    1. Heizmann CW, Fritz G, Schafer BW. S100 proteins: structure, functions and pathology. Front Biosci. 2002;7:1356–1368. - PubMed
    1. Marenholz I, Heizmann CW, Fritz G. S100 proteins in mouse and man: from evolution to function and pathology (including an update of the nomenclature) Biochem. Biophys. Res. Commun. 2004;322:1111–1122. - PubMed
    1. Donato R. S100: a multigenic family of calcium-modulated proteins of the EF-hand type with intracellular and extracellular functional roles. Int. J. Biochem. Cell. Biol. 2001;33:637–668. - PubMed

Publication types

Associated data