Selection for gene junction sequences important for VSV transcription
- PMID: 18783810
- PMCID: PMC2593152
- DOI: 10.1016/j.virol.2008.08.001
Selection for gene junction sequences important for VSV transcription
Abstract
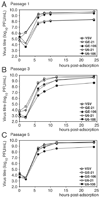
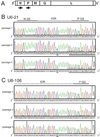
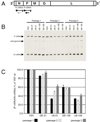
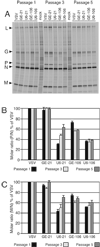
The heptauridine tract at each gene end and intergenic region (IGR) at the gene junctions of vesicular stomatitis virus (VSV) have effects on synthesis of the downstream mRNA, independent of their respective roles in termination of the upstream mRNA. To investigate the role of the U tract and the IGR in downstream gene transcription, we altered the N/P gene junction of infectious VSV such that transcription levels would be affected and result in altered molar ratios of the N and P proteins, which are critical for optimal viral RNA replication. The changes included extended IGRs between the N and P genes and shortening the length of the heptauridine tract upstream of the P gene start. Viruses having various combinations of these changes were recovered from cDNA and selective pressure for efficient viral replication was applied by sequential passage in cell culture. The replicative ability and sequence at the altered intergenic junctions were monitored throughout the passages to compare the effects of the changes at the IGR and U tract. VSV variants with wild-type U tracts upstream of the P gene replicated to levels similar to wt VSV. Variants with shortened U tracts were reduced in their ability to replicate. With passage, populations emerged that replicated to higher levels. Sequence analysis revealed that mutations had been selected for in these populations that increased the length of the U tract. This correlated with an increase in abundance of P mRNA and protein to provide improved N:P protein molar ratios. Extended IGRs resulted in decreased downstream transcription but the effect was not as extensive as that caused by shortened U tracts. Extended IGRs were not selected against in 5 passages. Our results indicate that the size of the upstream gene end U tract is an important determinant of efficient downstream gene transcription in infectious virus.
Figures


Similar articles
-
Identification of an upstream sequence element required for vesicular stomatitis virus mRNA transcription.J Virol. 2002 Aug;76(15):7632-41. doi: 10.1128/jvi.76.15.7632-7641.2002. J Virol. 2002. PMID: 12097577 Free PMC article.
-
Polyadenylation of vesicular stomatitis virus mRNA dictates efficient transcription termination at the intercistronic gene junctions.J Virol. 1998 Mar;72(3):1805-13. doi: 10.1128/JVI.72.3.1805-1813.1998. J Virol. 1998. PMID: 9499031 Free PMC article.
-
Mutational analyses of the intergenic dinucleotide and the transcriptional start sequence of vesicular stomatitis virus (VSV) define sequences required for efficient termination and initiation of VSV transcripts.J Virol. 1997 Mar;71(3):2127-37. doi: 10.1128/JVI.71.3.2127-2137.1997. J Virol. 1997. PMID: 9032346 Free PMC article.
-
Polymerase slippage at vesicular stomatitis virus gene junctions to generate poly(A) is regulated by the upstream 3'-AUAC-5' tetranucleotide: implications for the mechanism of transcription termination.J Virol. 2001 Aug;75(15):6901-13. doi: 10.1128/JVI.75.15.6901-6913.2001. J Virol. 2001. PMID: 11435570 Free PMC article.
-
The VSV polymerase can initiate at mRNA start sites located either up or downstream of a transcription termination signal but size of the intervening intergenic region affects efficiency of initiation.Virology. 2008 May 10;374(2):361-70. doi: 10.1016/j.virol.2007.12.023. Epub 2008 Jan 31. Virology. 2008. PMID: 18241907 Free PMC article.
Cited by
-
Widespread human exposure to ledanteviruses in Uganda: A population study.PLoS Negl Trop Dis. 2024 Jul 8;18(7):e0012297. doi: 10.1371/journal.pntd.0012297. eCollection 2024 Jul. PLoS Negl Trop Dis. 2024. PMID: 38976760 Free PMC article.
-
Analysis of the highly diverse gene borders in Ebola virus reveals a distinct mechanism of transcriptional regulation.J Virol. 2014 Nov;88(21):12558-71. doi: 10.1128/JVI.01863-14. Epub 2014 Aug 20. J Virol. 2014. PMID: 25142600 Free PMC article.
-
A vesiculovirus showing a steepened transcription gradient and dominant trans-repression of virus transcription.J Virol. 2012 Aug;86(16):8884-9. doi: 10.1128/JVI.00358-12. Epub 2012 Jun 6. J Virol. 2012. PMID: 22674990 Free PMC article.
-
How does the polymerase of non-segmented negative strand RNA viruses commit to transcription or genome replication?J Virol. 2024 Aug 20;98(8):e0033224. doi: 10.1128/jvi.00332-24. Epub 2024 Jul 30. J Virol. 2024. PMID: 39078194 Free PMC article. Review.
-
Transcriptional Regulation in Ebola Virus: Effects of Gene Border Structure and Regulatory Elements on Gene Expression and Polymerase Scanning Behavior.J Virol. 2015 Dec 9;90(4):1898-909. doi: 10.1128/JVI.02341-15. Print 2016 Feb 15. J Virol. 2015. PMID: 26656691 Free PMC article.
References
-
- Arnheiter H, Davis NL, Wertz G, Schubert M, Lazzarini RA. Role of the nucleocapsid protein in regulating vesicular stomatitis virus RNA synthesis. Cell. 1985;41(1):259–267. - PubMed
Publication types
MeSH terms
Substances
Grants and funding
LinkOut - more resources
Full Text Sources
Miscellaneous

