

Simulating calcium influx and free calcium concentrations in yeast
- PMID: 18783827
- PMCID: PMC3130064
- DOI: 10.1016/j.ceca.2008.07.005
Simulating calcium influx and free calcium concentrations in yeast
Abstract
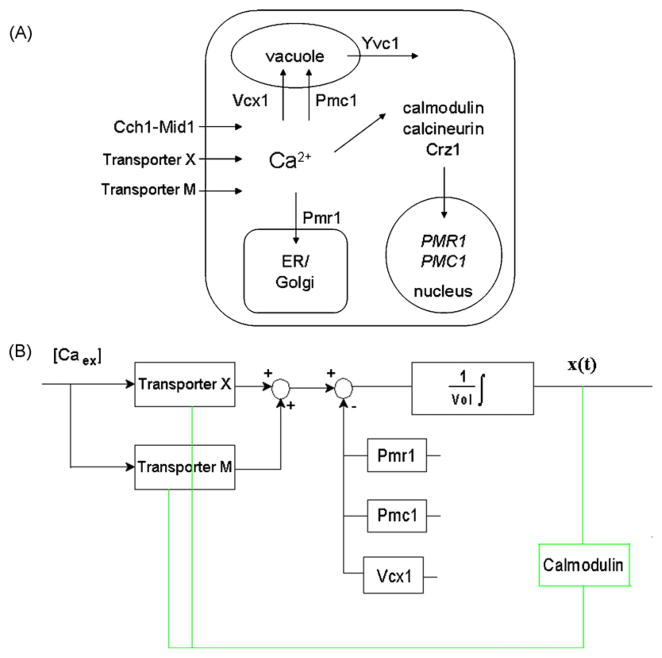
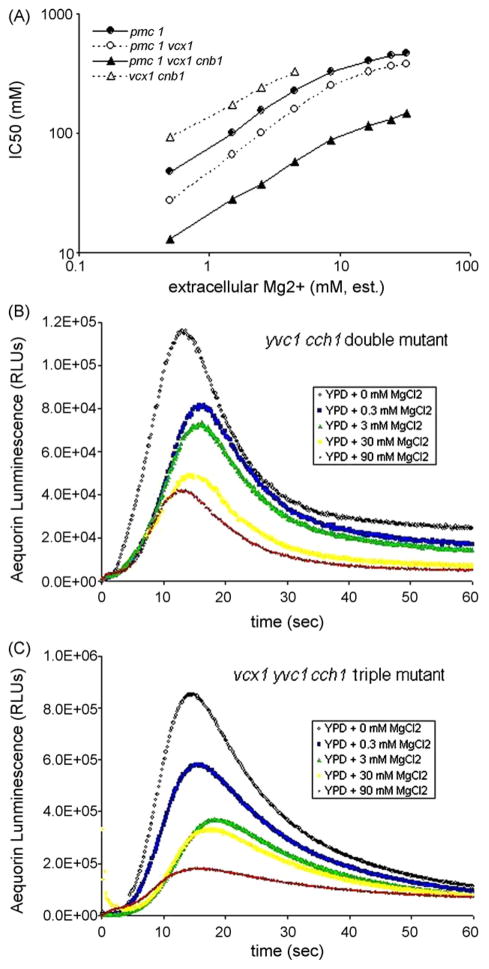
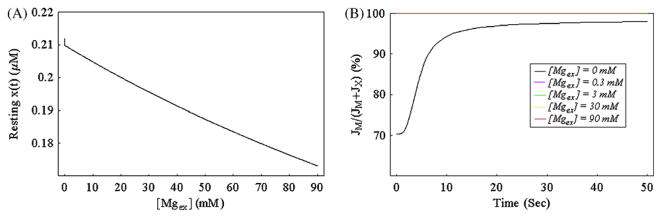
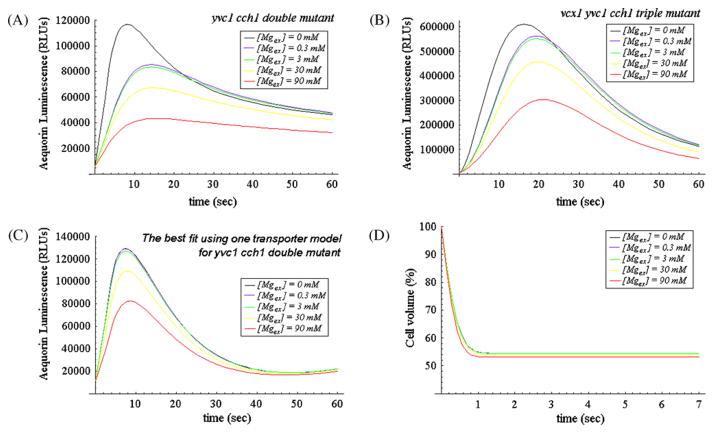
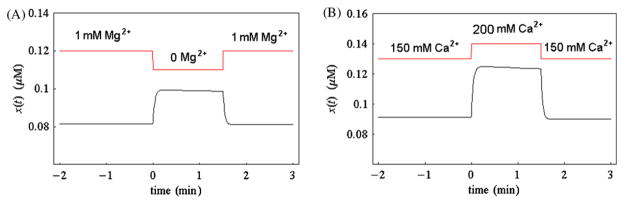
Yeast can proliferate in environments containing very high Ca(2+) primarily due to the activity of vacuolar Ca(2+) transporters Pmc1 and Vcx1. Yeast mutants lacking these transporters fail to grow in high Ca(2+) environments, but growth can be restored by small increases in environmental Mg(2+). Low extracellular Mg(2+) appeared to competitively inhibit novel Ca(2+) influx pathways and to diminish the concentration of free Ca(2+) in the cytoplasm, as judged from the luminescence of the photoprotein aequorin. These Mg(2+)-sensitive Ca(2+) influx pathways persisted in yvc1 cch1 double mutants. Based on mathematical models of the aequorin luminescence traces, we propose the existence in yeast of at least two Ca(2+) transporters that undergo rapid feedback inhibition in response to elevated cytosolic free Ca(2+) concentration. Finally, we show that Vcx1 helps return cytosolic Ca(2+) toward resting levels after shock with high extracellular Ca(2+) much more effectively than Pmc1 and that calcineurin, a protein phosphatase regulator of Vcx1 and Pmc1, had no detectable effects on these factors within the first few minutes of its activation. Therefore, computational modeling of Ca(2+) transport and signaling in yeast can provide important insights into the dynamics of this complex system.
Conflict of interest statement
None.
Figures
Similar articles
-
Calcineurin inhibits VCX1-dependent H+/Ca2+ exchange and induces Ca2+ ATPases in Saccharomyces cerevisiae.Mol Cell Biol. 1996 May;16(5):2226-37. doi: 10.1128/MCB.16.5.2226. Mol Cell Biol. 1996. PMID: 8628289 Free PMC article.
-
Ca(2+) homeostasis in the budding yeast Saccharomyces cerevisiae: Impact of ER/Golgi Ca(2+) storage.Cell Calcium. 2015 Aug;58(2):226-35. doi: 10.1016/j.ceca.2015.05.004. Epub 2015 May 29. Cell Calcium. 2015. PMID: 26055636
-
The involvement of calcium carriers and of the vacuole in the glucose-induced calcium signaling and activation of the plasma membrane H(+)-ATPase in Saccharomyces cerevisiae cells.Cell Calcium. 2012 Jan;51(1):72-81. doi: 10.1016/j.ceca.2011.10.008. Epub 2011 Dec 6. Cell Calcium. 2012. PMID: 22153127
-
Ca2+ transport in Saccharomyces cerevisiae.J Exp Biol. 1994 Nov;196:157-66. doi: 10.1242/jeb.196.1.157. J Exp Biol. 1994. PMID: 7823019 Review.
-
Vacuolar Ca(2+) uptake.Cell Calcium. 2011 Aug;50(2):139-46. doi: 10.1016/j.ceca.2011.01.004. Epub 2011 Feb 9. Cell Calcium. 2011. PMID: 21310481 Review.
Cited by
-
Calcineurin and Calcium Channel CchA Coordinate the Salt Stress Response by Regulating Cytoplasmic Ca2+ Homeostasis in Aspergillus nidulans.Appl Environ Microbiol. 2016 May 16;82(11):3420-3430. doi: 10.1128/AEM.00330-16. Print 2016 Jun 1. Appl Environ Microbiol. 2016. PMID: 27037124 Free PMC article.
-
Calcineurin Regulatory Subunit Calcium-Binding Domains Differentially Contribute to Calcineurin Signaling in Saccharomyces cerevisiae.Genetics. 2018 Jul;209(3):801-813. doi: 10.1534/genetics.118.300911. Epub 2018 May 7. Genetics. 2018. PMID: 29735720 Free PMC article.
-
Physiological Overview of the Potential Link between the UPS and Ca2+ Signaling.Antioxidants (Basel). 2022 May 19;11(5):997. doi: 10.3390/antiox11050997. Antioxidants (Basel). 2022. PMID: 35624861 Free PMC article. Review.
-
The chromogranin A-derived antifungal peptide CGA-N9 induces apoptosis in Candida tropicalis.Biochem J. 2019 Oct 30;476(20):3069-3080. doi: 10.1042/BCJ20190483. Biochem J. 2019. PMID: 31652303 Free PMC article.
-
A Noisy Analog-to-Digital Converter Connects Cytosolic Calcium Bursts to Transcription Factor Nuclear Localization Pulses in Yeast.G3 (Bethesda). 2019 Feb 7;9(2):561-570. doi: 10.1534/g3.118.200841. G3 (Bethesda). 2019. PMID: 30573469 Free PMC article.
References
-
- Abelovska L, Bujdos M, Kubova J, Petrezselyova S, Nosek J, Tomaska L. Comparison of element levels in minimal and complex yeast media. Can J Microbiol. 2007;53:533–535. - PubMed
-
- Alberts B, Johnson A, Lewis J, Raff M, Roberts K, Walter P. Molecular Biology of the Cell. Garland Publishing, Inc; New York: 2002.
-
- Allen DG, Blinks JR, Prendergast FG. Aequorin luminescence: relation of light emission to calcium concentration—a calcium-independent component. Science. 1977;195:996–998. - PubMed
-
- Batiza AF, Schulz T, Masson PH. Yeast respond to hypotonic shock with a calcium pulse. J Biol Chem. 1996;271:23357–23362. - PubMed
-
- Beckstein O, Biggin PC, Bond P, Bright JN, Domene C, Grottesi A, et al. Ion channel gating: insights via molecular simulations. FEBS Lett. 2003;555:85–90. - PubMed
Publication types
MeSH terms
Substances
Grants and funding
LinkOut - more resources
Full Text Sources
Molecular Biology Databases
Miscellaneous
