

doi: 10.1074/jbc.M804112200.
Epub 2008 Sep 10.
CCL2 increases X4-tropic HIV-1 entry into resting CD4+ T cells
Affiliations
- PMID: 18784079
- PMCID: PMC2576528
- DOI: 10.1074/jbc.M804112200
Item in Clipboard
CCL2 increases X4-tropic HIV-1 entry into resting CD4+ T cells
J Biol Chem.
.
Abstract
During human immunodeficiency virus type 1 (HIV-1) infection, there is a strong positive correlation between CCL2 levels and HIV viral load. To determine whether CCL2 alters HIV-1 infection of resting CD4(+) T cells, we infected purified resting CD4(+) T cells after incubation with CCL2. We show that CCL2 up-regulates CXCR4 on resting CD4(+) T cells in a CCR2-dependent mechanism, and that this augmentation of CXCR4 expression by CCL2 increases the ability of these cells to be chemoattracted to CXCR4 using gp120 and renders them more permissive to X4-tropic HIV-1 infection. Thus, CCL2 has the capacity to render a large population of lymphocytes more susceptible to HIV-1 late in the course of infection.
Figures
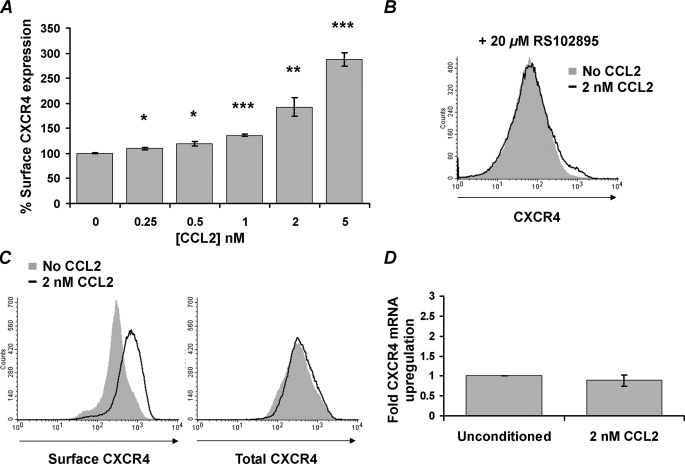
CCL2 induces up-regulation of surface CXCR4 expression on resting
CD4+ T cells through a CCR2-dependent mechanism that does not
require de novo protein synthesis. A, purified resting
CD4+ T cells from HIV-negative subjects were incubated with
increasing concentrations of CCL2. After 4 h, cells were harvested and stained
for surface CXCR4. CCL2 induced a dose-dependent increase in surface
expression of CXCR4. Data are expressed as means ± S.E. of the mean
fluorescence intensity calculated from three independent experiments.
B, purified resting CD4+ T cells were pretreated with 20
μm RS102895 and cultured for 4 h in the presence of 2
nm CCL2 (black line histogram) or with vehicle control
(solid gray histogram). Cells were then harvested and stained for
surface CXCR4. Histograms are shown for a representative donor.
C, purified resting CD4+ T cells were incubated with 2
nm CCL2 (black line histogram) or with vehicle control
(solid gray histogram) for 4 h. Cells were then stained for surface
CXCR4 or permeabilized and stained for total CXCR4. Histograms are
shown from a representative donor. D, CXCR4 mRNA content was
evaluated using real time PCR after 4 h of incubation with 2 nm
CCL2. *, p < 0.05; **, p < 0.01;
***, p < 0.001.
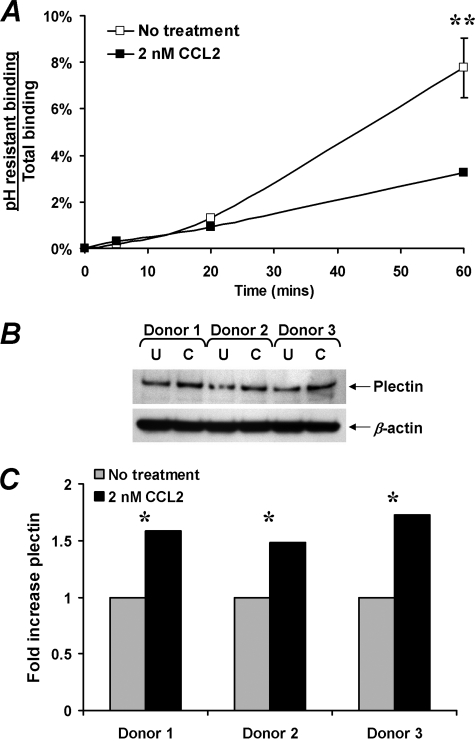
Effect of CCL2 on CXCR4 internalization and on plectin content.
A, CXCR4 internalization was quantified by flow cytometric assessment
of anti-CXCR4 antibody binding following acid stripping of cell surface-bound
antibody. Acid-resistant binding (internalized CXCR4) is expressed as a
fraction of total antibody binding over 1 h of incubation at 37 °C. CCL2
reduced CXCR4 internalization rates by 42% across four experiments
(**, p = 0.03). B, effect of CCL2 on plectin
expression. Western blot was used to quantify plectin levels in resting
CD4+ T cells cultured for 4 h in the presence of 0 (U) or
2 nm CCL2 (C). Parallel determination of β-actin
verified equivalent protein loading. C, densitometric analysis of the
protein bands revealed that CCL2 conditioning of resting CD4+ T
cells significantly increased plectin content (*, p =
0.01).

CD4+ T cell migration induced by 200 nm gp120
protein alone or with prior conditioning with 1 nm CCL2 and/or
inhibitors. Bars represent the mean ± S.E. number of
migrated cells of three independent experiments performed in triplicate. Cells
not pretreated with an inhibitor or antibody are represented by white
bars. In some instances the cells were also treated with 20
μm RS102895 (black bars), 1 μm AMD3100
(gray bars), 1 μg/ml PTX (white striped bars), or 10
μg/ml anti-CD3 antibody (gray striped bars). Experiments were
performed three times in triplicate. Chemokinesis was minimal when equal
concentrations of gp120 were added to both the apical and basal chambers and
has been subtracted from these histograms. X4 gp120MN induced
chemotaxis of CD4+ T cells and was augmented by preconditioning
with 1 nm CCL2. The augmentation was abrogated in the presence of
RS102895 (p < 0.0001). Treatment with AMD3100, PTX, or anti-CD3
antibody inhibited X4 gp120MN induced chemotaxis. R5
gp120SF162 induced minimal chemotaxis and was unaffected by all
inhibitor and stimulus treatments. *, p < 0.0001.
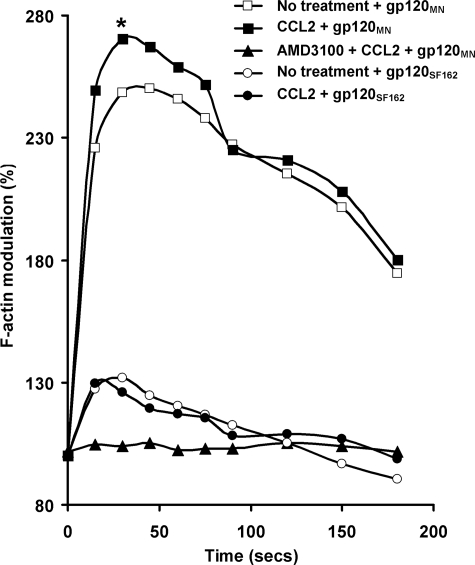
CCL2 augments X4 gp120MN-induced F-actin polymerization in
resting CD4+ T cells. Using FITC-phalloidin as a probe for
intracellular F-actin, the effects of CCL2 pre-conditioning on F-actin
polymerization in resting CD4+ T cells was assessed by flow
cytometry. Results show the kinetics of F-actin polymerization following
stimulation of unconditioned cells with R5 gp120SF162 (open
circles) or X4 gp120MN (open squares). The change in
F-actin content is expressed as a relative fold change in the median
fluorescence intensity, when the base-line fluorescence intensity before
addition of ligand (time 0) is expressed as 100%. CCL2
preconditioning of resting CD4+ T cells significantly increased the
content of X4 gp120-induced F-actin (solid squares; *,
p = 0.022) but had no effect on R5 gp120-induced F-actin (solid
circles; p = 0.89). AMD3100 inhibited the increase in X4
gp120-induced F-actin content (solid triangles). All data presented
are representative of three independent experiments.
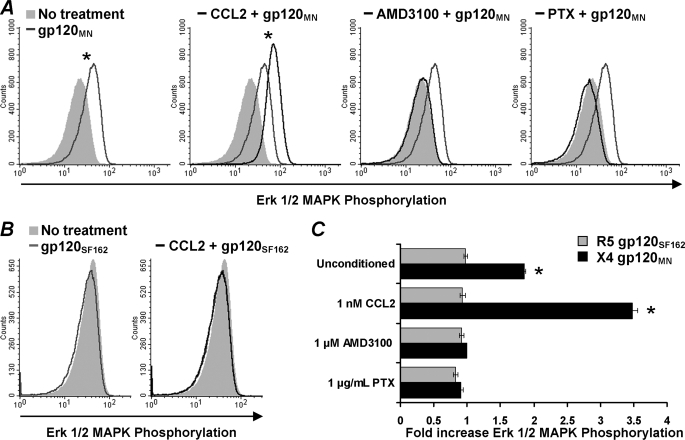
CCL2 augments X4 gp120-induced Erk 1/2 phosphorylation in primary
resting CD4+ T cells. Primary resting CD4+ T cells
were stimulated with gp120 for 2 min, fixed, permeabilized/ and stained with a
fluorescently tagged antibody specific for phosphorylated Erk 1/2 and then
analyzed by flow cytometry. A, Erk 1/2 phosphorylation induced by X4
tropic gp120MN. Histograms shown are from a representative
donor. Solid gray histogram in each image corresponds to cells not
stimulated with 200 nm gp120MN. Light gray line
corresponds to unconditioned cells stimulated with 200 nm
gp120MN. Black line corresponds to pretreatment with
either 1 nm CCL2, 1 μm AMD3100, or 1 μg/ml PTX.
B, Erk 1/2 phosphorylation induced by R5-tropic
gp120SF162. Histograms shown are from a representative
donor. Solid gray histogram in each image corresponds to cells not
stimulated with 200 nm gp120SF162. Light gray
line corresponds to unconditioned cells stimulated with 200 nm
gp120SF162. Black line in -CCL2 corresponds to
pretreatment with 1 nm CCL2. C, bars represents the mean
± S.E. of the relative change in fluorescence intensity indicative of
Erk 1/2 phosphorylation after stimulation with X4 gp120MN
(black bars) or R5 gp120SF162 (gray bars) from
three independent donors carried out in triplicate. The change in Erk 1/2
phosphorylation is expressed as the relative fold change in the mean
fluorescence intensity, with the base-line fluorescence intensity before the
addition of gp120 expressed as 1.00. CCL2 preconditioning of resting
CD4+ T cells significantly increased X4 gp120-induced
phosphorylation of Erk 1/2 (p < 0.0001) but had no effect on R5
gp120-induced events. AMD3100 and PTX inhibited Erk 1/2 phosphorylation.
*, p < 0.0001.
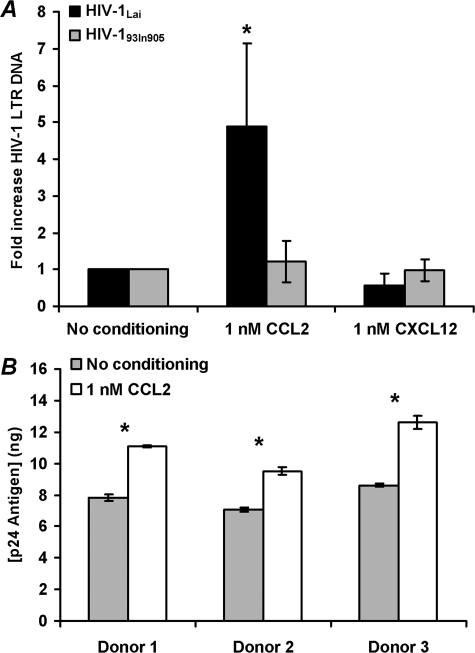
CCL2 augments X4 HIV-1 infection of primary resting CD4+ T
cells. A, purified resting CD4+ T cells were
conditioned with 1 nm CCL2, 1 nm CXCL12, or left
unconditioned for 4 h before infection with X4-tropic HIV-1Lai
(black bars) or the R5-tropic HIV-193In905 (gray
bars) at a multiplicity of infection of 0.01 for 3 h. Cells were then
cultured for 14 h without further stimulation. Entry of HIV-1 was evaluated by
real time PCR using primers specific for the LTR R/U5 region as described
under “Experimental Procedures” (means ± S.E.; n =
3). CCL2 conditioning significantly augmented X4-tropic HIV-1Lai
infection of resting CD4+ T cells (*, p <
0.05) and had no effect on R5-tropic HIV-193In905 infection.
B, cells infected with X4-tropic HIV-1Lai as described
above were further cultured in the presence of 20 units/ml IL-2. After 96 h,
supernatants were collected from unconditioned (gray bars) and
CCL2-conditioned (white bars) infected cells and p24-quantified. CCL2
conditioning significantly augmented X4-tropic HIV-1Lai infection
of resting CD4+ T cells (*, p < 0.05).
References
-
- Mengozzi, M., De Filippi, C., Transidico, P., Biswas, P., Cota, M., Ghezzi, S., Vicenzi, E., Mantovani, A., Sozzani, S., and Poli, G. (1999) Blood 93 1851-1857 - PubMed
-
- Park, I. W., Wang, J. F., and Groopman, J. E. (2001) Blood 97 352-358 - PubMed
-
- Fantuzzi, L., Canini, I., Belardelli, F., and Gessani, S. (2001) J. Immunol. 166 5381-5387 - PubMed
Publication types
MeSH terms
Substances
Grants and funding
LinkOut - more resources
Full Text Sources
Medical
Research Materials
