

Synaptotagmin C2B domain regulates Ca2+-triggered fusion in vitro: critical residues revealed by scanning alanine mutagenesis
- PMID: 18784080
- PMCID: PMC2581593
- DOI: 10.1074/jbc.M803355200
Synaptotagmin C2B domain regulates Ca2+-triggered fusion in vitro: critical residues revealed by scanning alanine mutagenesis
Abstract
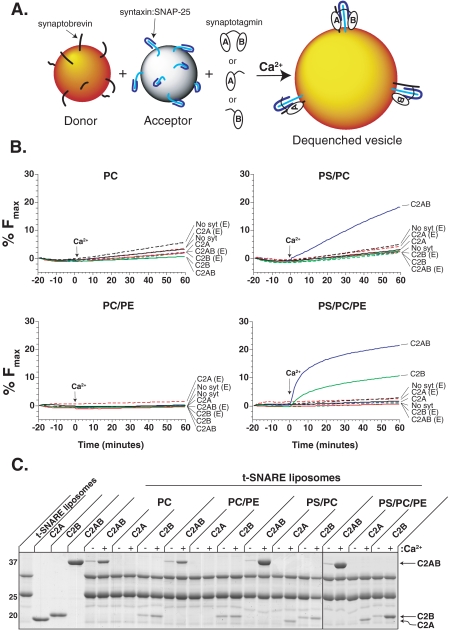
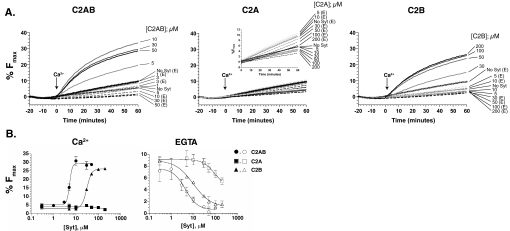
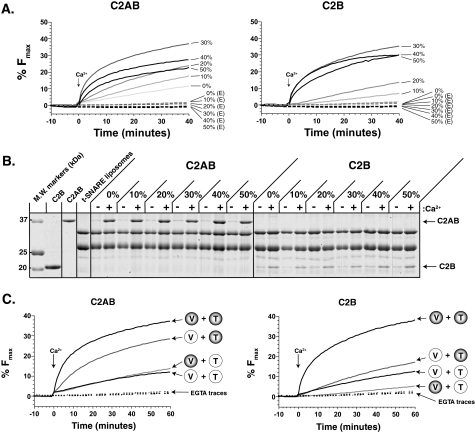
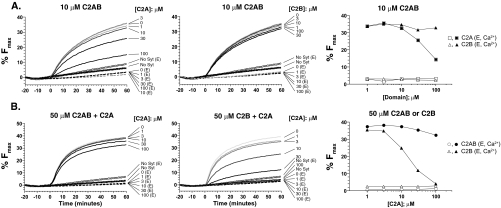
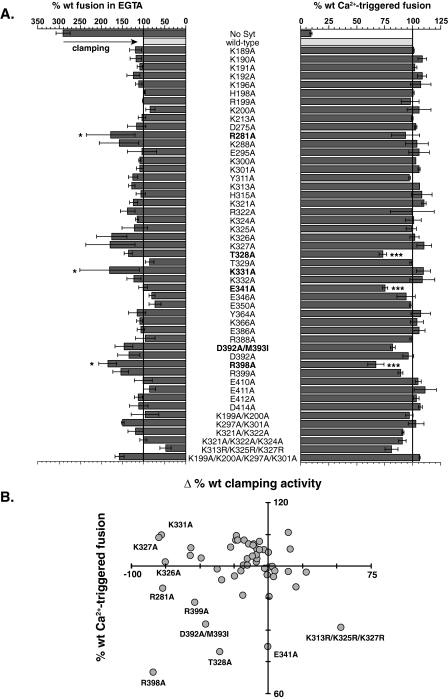
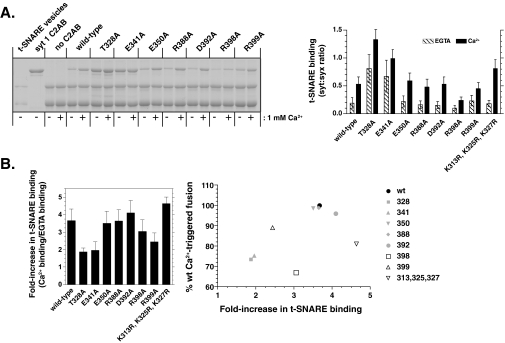
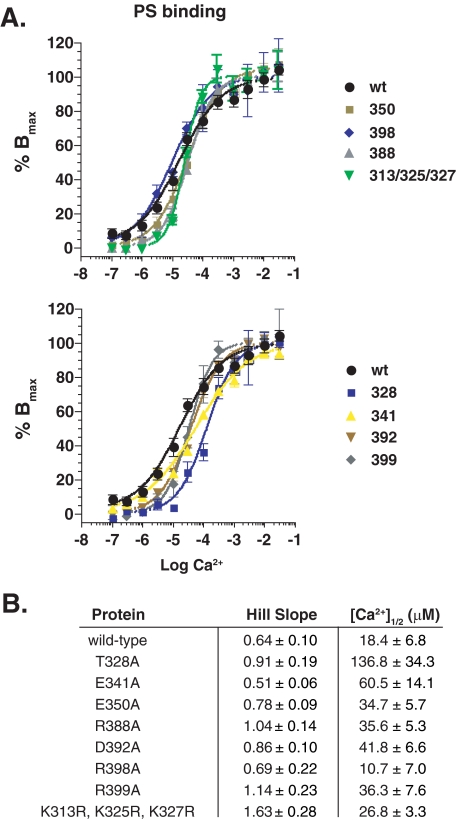
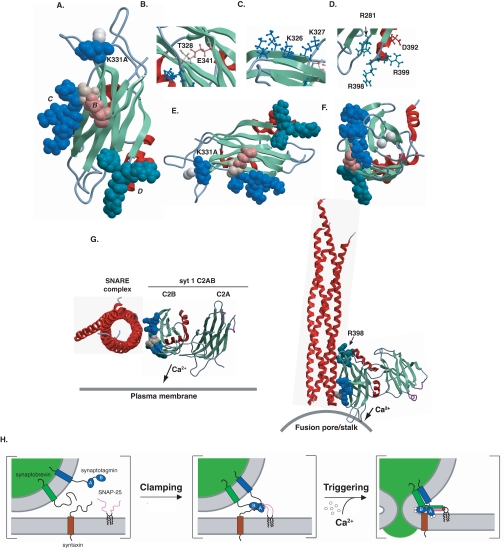
Synaptotagmin (syt) 1 is localized to synaptic vesicles, binds Ca2+, and regulates neuronal exocytosis. Syt 1 harbors two Ca2+-binding motifs referred to as C2A and C2B. In this study we examine the function of the isolated C2 domains of Syt 1 using a reconstituted, SNARE (soluble N-ethylmaleimide-sensitive factor attachment receptor)-mediated, fusion assay. We report that inclusion of phosphatidylethanolamine into reconstituted SNARE vesicles enabled isolated C2B, but not C2A, to regulate Ca2+-triggered fusion. The isolated C2B domain had a 6-fold lower EC50 for Ca2+-activated fusion than the intact cytosolic domain of Syt 1 (C2AB). Phosphatidylethanolamine increased both the rate and efficiency of C2AB- and C2B-regulated fusion without affecting their abilities to bind membrane-embedded syntaxin-SNAP-25 (t-SNARE) complexes. At equimolar concentrations, the isolated C2A domain was an effective inhibitor of C2B-, but not C2AB-regulated fusion; hence, C2A has markedly different effects in the fusion assay depending on whether it is tethered to C2B. Finally, scanning alanine mutagenesis of C2AB revealed four distinct groups of mutations within the C2B domain that play roles in the regulation of SNARE-mediated fusion. Surprisingly, substitution of Arg-398 with alanine, which lies on the opposite end of C2B from the Ca2+/membrane-binding loops, decreases C2AB t-SNARE binding and Ca2+-triggered fusion in vitro without affecting Ca2+-triggered interactions with phosphatidylserine or vesicle aggregation. In addition, some mutations uncouple the clamping and stimulatory functions of syt 1, suggesting that these two activities are mediated by distinct structural determinants in C2B.
Figures
Similar articles
-
Membrane-Binding Cooperativity and Coinsertion by C2AB Tandem Domains of Synaptotagmins 1 and 7.Biophys J. 2019 Mar 19;116(6):1025-1036. doi: 10.1016/j.bpj.2019.01.035. Epub 2019 Feb 5. Biophys J. 2019. PMID: 30795874 Free PMC article.
-
Mutations in the effector binding loops in the C2A and C2B domains of synaptotagmin I disrupt exocytosis in a nonadditive manner.J Biol Chem. 2003 Nov 21;278(47):47030-7. doi: 10.1074/jbc.M306728200. Epub 2003 Sep 8. J Biol Chem. 2003. PMID: 12963743
-
Synaptotagmin C2A loop 2 mediates Ca2+-dependent SNARE interactions essential for Ca2+-triggered vesicle exocytosis.Mol Biol Cell. 2007 Dec;18(12):4957-68. doi: 10.1091/mbc.e07-04-0368. Epub 2007 Oct 3. Mol Biol Cell. 2007. PMID: 17914059 Free PMC article.
-
The C2 domains of synaptotagmin--partners in exocytosis.Trends Biochem Sci. 2004 Mar;29(3):143-51. doi: 10.1016/j.tibs.2004.01.008. Trends Biochem Sci. 2004. PMID: 15003272 Review.
-
Role of synaptotagmin, a Ca2+ and inositol polyphosphate binding protein, in neurotransmitter release and neurite outgrowth.Chem Phys Lipids. 1999 Apr;98(1-2):59-67. doi: 10.1016/s0009-3084(99)00018-3. Chem Phys Lipids. 1999. PMID: 10358928 Review.
Cited by
-
Cytotoxic Granule Trafficking and Fusion in Synaptotagmin7-Deficient Cytotoxic T Lymphocytes.Front Immunol. 2020 May 29;11:1080. doi: 10.3389/fimmu.2020.01080. eCollection 2020. Front Immunol. 2020. PMID: 32547563 Free PMC article.
-
Complexins: small but capable.Cell Mol Life Sci. 2015 Nov;72(22):4221-35. doi: 10.1007/s00018-015-1998-8. Epub 2015 Aug 6. Cell Mol Life Sci. 2015. PMID: 26245303 Free PMC article. Review.
-
Arabidopsis synaptotagmin SYT1, a type I signal-anchor protein, requires tandem C2 domains for delivery to the plasma membrane.J Biol Chem. 2010 Jul 23;285(30):23165-76. doi: 10.1074/jbc.M109.084046. Epub 2010 May 24. J Biol Chem. 2010. PMID: 20498364 Free PMC article.
-
The high-affinity calcium sensor synaptotagmin-7 serves multiple roles in regulated exocytosis.J Gen Physiol. 2018 Jun 4;150(6):783-807. doi: 10.1085/jgp.201711944. Epub 2018 May 24. J Gen Physiol. 2018. PMID: 29794152 Free PMC article. Review.
-
Neurotransmitter release is triggered by a calcium-induced rearrangement in the Synaptotagmin-1/SNARE complex primary interface.bioRxiv [Preprint]. 2024 Jun 21:2024.06.17.599435. doi: 10.1101/2024.06.17.599435. bioRxiv. 2024. Update in: Proc Natl Acad Sci U S A. 2024 Oct 15;121(42):e2409636121. doi: 10.1073/pnas.2409636121. PMID: 38948868 Free PMC article. Updated. Preprint.
References
-
- Katz, B., and Miledi, R. (1965) Proc. R. Soc. Lond. B. Biol. Sci. 161 496-503 - PubMed
-
- Rothman, J. E. (1994) Nature 372 55-63 - PubMed
-
- Chapman, E. R. (2008) Ann. Rev. Biochem. 77 615-641 - PubMed
-
- Perin, M. S., Brose, N., Jahn, R., and Sudhof, T. C. (1991) J. Biol. Chem. 266 623-629 - PubMed
-
- Chapman, E. R., and Davis, A. F. (1998) J. Biol. Chem. 273 13995-14001 - PubMed
Publication types
MeSH terms
Substances
Grants and funding
LinkOut - more resources
Full Text Sources
Miscellaneous
