c-Fos activates glucosylceramide synthase and glycolipid synthesis in PC12 cells
- PMID: 18784083
- PMCID: PMC2662181
- DOI: 10.1074/jbc.M709257200
c-Fos activates glucosylceramide synthase and glycolipid synthesis in PC12 cells
Abstract
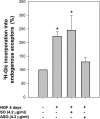
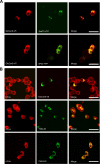
It has been demonstrated that c-Fos has, in addition to its well recognized AP-1 transcription factor activity, the capacity to associate to the endoplasmic reticulum and activate key enzymes involved in the synthesis of phospholipids required for membrane biogenesis during cell growth and neurite formation. Because membrane genesis requires the coordinated supply of all its integral membrane components, the question emerges as to whether c-Fos also activates the synthesis of glycolipids, another ubiquitous membrane component. We show that c-Fos activates the metabolic labeling of glycolipids in differentiating PC12 cells. Specifically, c-Fos activates the enzyme glucosylceramide synthase (GlcCerS), the product of which, GlcCer, is the first glycosylated intermediate in the pathway of synthesis of glycolipids. By contrast, the activities of GlcCer galactosyltransferase 1 and lactosylceramide sialyltransferase 1 are essentially unaffected by c-Fos. Co-immunoprecipitation experiments in cells co-transfected with c-Fos and a V5-tagged version of GlcCerS evidenced that both proteins participate in a physical association. c-Fos expression is tightly regulated by specific environmental cues. This strict regulation assures that lipid metabolism activation will occur as a response to cell requirements thus pointing to c-Fos as an important regulator of key membrane metabolisms in membrane biogenesis-demanding processes.
Figures


Similar articles
-
c-Fos activates and physically interacts with specific enzymes of the pathway of synthesis of polyphosphoinositides.Mol Biol Cell. 2011 Dec;22(24):4716-25. doi: 10.1091/mbc.E11-03-0259. Epub 2011 Oct 12. Mol Biol Cell. 2011. PMID: 21998197 Free PMC article.
-
c-Fos associates with the endoplasmic reticulum and activates phospholipid metabolism.FASEB J. 2001 Mar;15(3):556-8. doi: 10.1096/fj.00-0446fje. Epub 2001 Jan 5. FASEB J. 2001. PMID: 11259365
-
c-Fos activated phospholipid synthesis is required for neurite elongation in differentiating PC12 cells.Mol Biol Cell. 2004 Apr;15(4):1881-94. doi: 10.1091/mbc.e03-09-0705. Epub 2004 Feb 6. Mol Biol Cell. 2004. PMID: 14767061 Free PMC article.
-
c-Fos: an AP-1 transcription factor with an additional cytoplasmic, non-genomic lipid synthesis activation capacity.Biochim Biophys Acta. 2014 Sep;1841(9):1241-6. doi: 10.1016/j.bbalip.2014.05.007. Epub 2014 Jun 2. Biochim Biophys Acta. 2014. PMID: 24886961 Review.
-
[Glycoconjugates biosynthesis of plasma membranes of mammalian cells (author's transl)].Postepy Biochem. 1981;27(2):157-79. Postepy Biochem. 1981. PMID: 6460994 Review. Polish. No abstract available.
Cited by
-
The UDP-glucose ceramide glycosyltransferase (UGCG) and the link to multidrug resistance protein 1 (MDR1).BMC Cancer. 2018 Feb 6;18(1):153. doi: 10.1186/s12885-018-4084-4. BMC Cancer. 2018. PMID: 29409484 Free PMC article. Review.
-
Controlling cytoplasmic c-Fos controls tumor growth in the peripheral and central nervous system.Neurochem Res. 2012 Jun;37(6):1364-71. doi: 10.1007/s11064-012-0763-8. Epub 2012 Apr 5. Neurochem Res. 2012. PMID: 22476983
-
c-Fos activates and physically interacts with specific enzymes of the pathway of synthesis of polyphosphoinositides.Mol Biol Cell. 2011 Dec;22(24):4716-25. doi: 10.1091/mbc.E11-03-0259. Epub 2011 Oct 12. Mol Biol Cell. 2011. PMID: 21998197 Free PMC article.
-
Identification of conserved gene expression changes across common glomerular diseases by spatial transcriptomics.J Nephrol. 2025 Mar 11. doi: 10.1007/s40620-025-02233-5. Online ahead of print. J Nephrol. 2025. PMID: 40067649
-
pARIS-htt: an optimised expression platform to study huntingtin reveals functional domains required for vesicular trafficking.Mol Brain. 2010 Jun 1;3:17. doi: 10.1186/1756-6606-3-17. Mol Brain. 2010. PMID: 20515468 Free PMC article.
References
-
- Bonifacino, J. S., and Glick, B. S. (2004) Cell 116 156-166 - PubMed
-
- Morgan, J. I., Cohen, D. R., Hempstead, J. L., and Curran, T. (1987) Science 237 192-196 - PubMed
-
- Kouzarides, T., and Ziff, E. (1989) Nature 340 568-571 - PubMed
-
- Angel, P., and Karin, M. (1991) Biochim. Biophys. Acta 1072 129-157 - PubMed
-
- Morgan, J. I., and Curran, T. (1995) Trends Neurosci. 18 66-67 - PubMed
Publication types
MeSH terms
Substances
Grants and funding
LinkOut - more resources
Full Text Sources

