. 2008 Nov;100(5):2615-26.
doi: 10.1152/jn.90752.2008. Epub 2008 Sep 10.

Imbalance of neocortical excitation and inhibition and altered UP states reflect network hyperexcitability in the mouse model of fragile X syndrome

Affiliations

Imbalance of neocortical excitation and inhibition and altered UP states reflect network hyperexcitability in the mouse model of fragile X syndrome

Jay R Gibson et al. J Neurophysiol. 2008 Nov.

Abstract

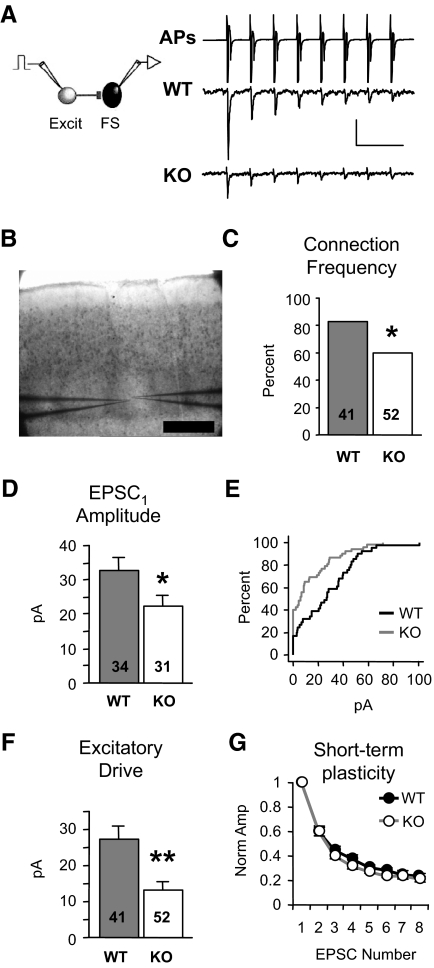
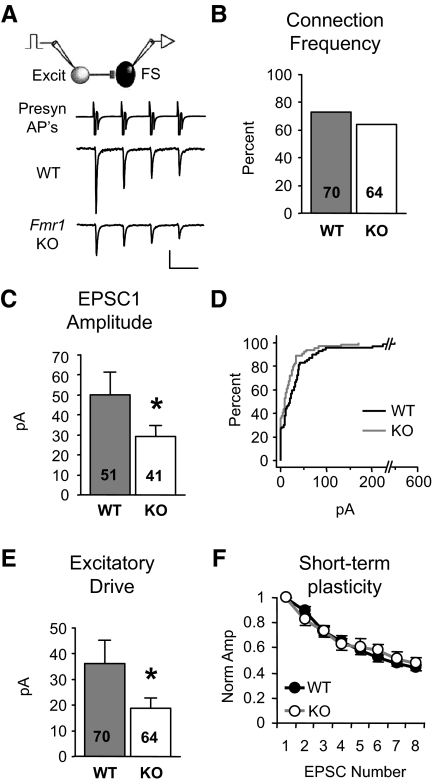
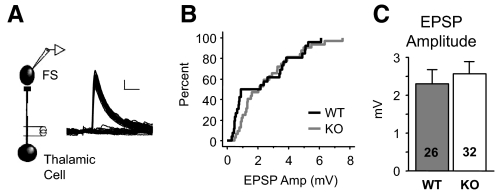
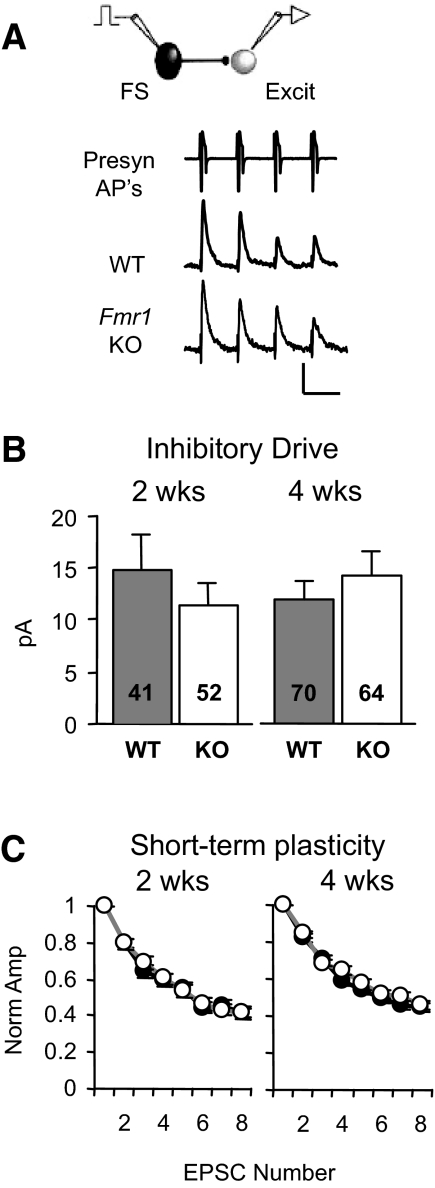
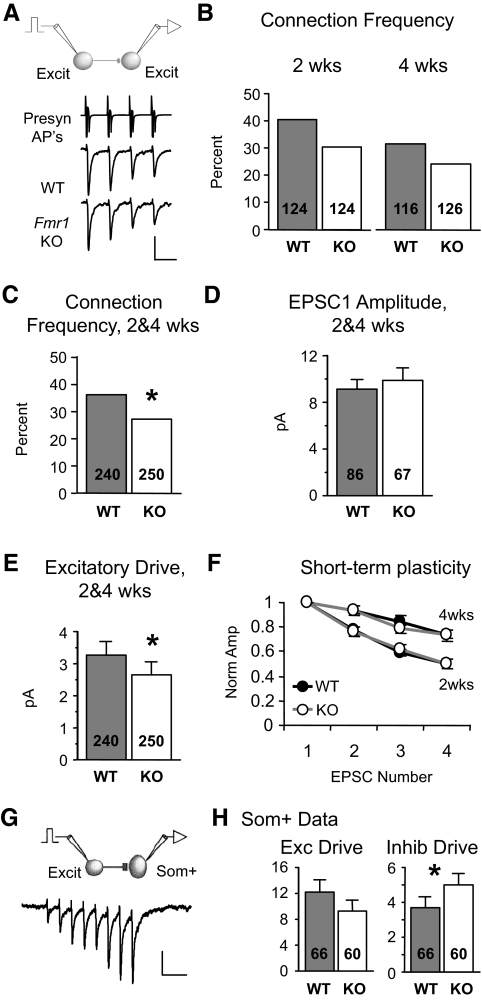
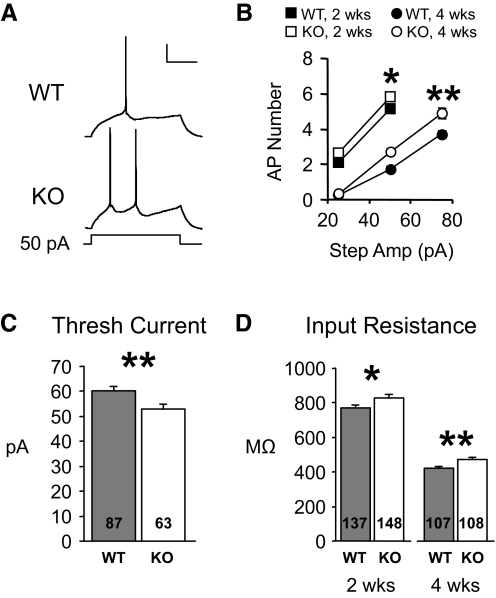
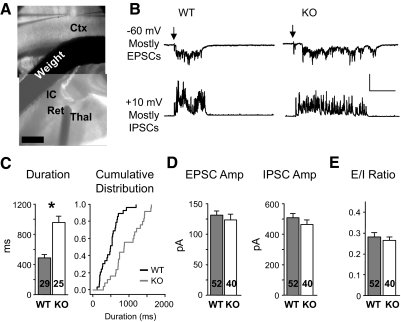
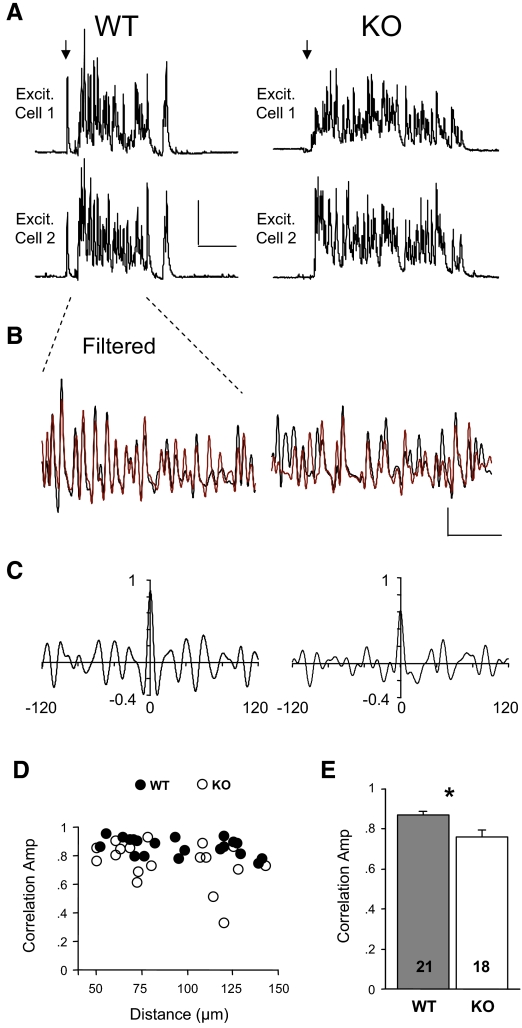
Despite the pronounced neurological deficits associated with mental retardation and autism, it is unknown if altered neocortical circuit function occurs in these prevalent disorders. Here we demonstrate specific alterations in local synaptic connections, membrane excitability, and circuit activity of defined neuron types in sensory neocortex of the mouse model of Fragile X Syndrome-the Fmr1 knockout (KO). Overall, these alterations result in hyperexcitability of neocortical circuits in the Fmr1 KO. Specifically, we observe a substantial deficit in local excitatory drive ( approximately 50%) targeting fast-spiking (FS) inhibitory neurons in layer 4 of somatosensory, barrel cortex. This persists until at least 4 wk of age suggesting it may be permanent. In contrast, monosynaptic GABAergic synaptic transmission was unaffected. Overall, these changes indicate that local feedback inhibition in neocortical layer 4 is severely impaired in the Fmr1 KO mouse. An increase in the intrinsic membrane excitability of excitatory neurons may further contribute to hyperexcitability of cortical networks. In support of this idea, persistent neocortical circuit activity, or UP states, elicited by thalamic stimulation was longer in duration in the Fmr1 KO mouse. In addition, network inhibition during the UP state was less synchronous, including a 14% decrease in synchrony in the gamma frequency range (30-80 Hz). These circuit changes may be involved in sensory stimulus hypersensitivity, epilepsy, and cognitive impairment associated with Fragile X and autism.


Figures

FIG. 1.
FIG. 1.
Local excitation onto neocortical fast-spiking (FS) inhibitory neurons is dramatically reduced in Fmr1 knockout (KO) mice. A: examples of presynaptic action potentials (APs) being evoked in the excitatory neuron (top, truncated vertically) and resulting unitary excitatory postsynaptic currents (EPSCs) in layer 4 FS neurons (bottom). APs are elicited in voltage clamp and occur due to voltage escape at the site of AP generation. The waveform of the presynaptic neuron represent the currents generated by the APs. EPSCs are averages from single neurons. Scale bars: vertical, 700 and 10 pA for APs and EPSCs, respectively. Horizontal, 50 ms. B: paired recordings were performed inside layer 4 barrels Scale bar: 250 μm. C: the percentage of synaptically connected excitatory and FS inhibitory neuron pairs is reduced in the KO [χ2; number of total cell pairs tested (n) is indicated in each bar; 34/41 and 31/52, connected/total tested]. D: when a connection existed, average amplitude of EPSC1 (1st EPSC in a train) was significantly decreased in the KO. Number of connected cell pairs (n) is indicated in each bar. E: cumulative distribution of amplitudes, including “nonconnected” pairs (0 pA), from wild-type (WT, black) and KO (gray) mice. F: excitatory drive, the average of both connected and nonconnected pairs, is reduced by 51%. Number of total cell pairs tested (n) is indicated in each bar. G: no change in short-term plasticity of EPSCs was observed (n = 22,16 connected pairs; quantified by an STP index as described in methods). Each EPSC in the train is normalized to EPSC1. *P < 0.03, **P < 0.005. Sample numbers as described in the preceding text apply to similar graphs in subsequent figures. See methods for statistics used.
FIG. 2.
FIG. 2.
Deficit in local excitation of FS neurons persists in adolescent Fmr1 KO mice. A: examples of unitary EPSCs targeting layer 4 FS neurons in slices obtained from 4-wk-old animals. Only 1st 4 EPSCs shown. Scale bars: 1,000 and 20 pA, 50 ms. B: no change in connection frequency. CE: EPSC1 amplitude and drive are decreased while short-term plasticity (F, n = 33,26) is unchanged. *P < 0.04.
FIG. 3.
FIG. 3.
Evoked thalamic responses onto FS neurons are unaffected. A: example of thalamically evoked EPSPs in a WT layer 4 FS neuron. A minimal stimulation method was used to obtain a mix of successes and failures of evoked transmission where successes represent putative unitary responses. Scale bars: 1 mV, 5 ms. B and C: summary of minimal stimulation data indicating no change in the cumulative distribution (B) or average EPSP size (C) originating from thalamic afferents. Sample number is stimulus site number obtained from 16 and 20 cells. The numbers in the graph are greater because 2 stimulus sites were examined for a single cell in a subset of recordings.
FIG. 4.
FIG. 4.
Inhibitory postsynaptic currents (IPSCs) originating from FS neurons are unaltered in the Fmr1 KO. A: unitary IPSCs targeting layer 4 excitatory neurons in slices obtained from 2-wk-old animals. Only 1st 4 EPSCs shown. Scale bars: 1,000 and 10 pA, 50 ms. Inhibitory drive (B) and short-term plasticity (C; for 2 wk: n = 14,22; for 4 wk, n = 22,25) are unaltered at both ages.
FIG. 5.
FIG. 5.
Local excitation between excitatory neurons is decreased, but to a lesser extent. A: examples of EPSCs targeting layer 4 excitatory neurons in slices obtained from 2-wk-old animals. Scale bars: 1,000 and 10 pA, 50 ms. B: connection frequency was not detectably different at either 2 or 4 wk of age but showed a similar trend. C: connection frequency is decreased in the Fmr1 KO when 2 and 4 wk data are pooled. D: no detectable change in amplitude with pooled data (shown) and unpooled data (not shown). E: excitatory drive is decreased in the KO. F: no change in short-term plasticity with both pooled (not shown) and unpooled data (for 2 wk: n = 20,15; for 4 wk, n = 16,16). Short-term plasticity was dependent on age (P < 0.01). G: example of EPSCs in a WT somatostatin-positive (Som+) inhibitory neuron evoked by a 20-Hz train of action potentials in a presynaptic pyramidal neuron. APs are not shown. Scale bars: 10 pA, 100 ms. H: no difference in local excitatory drive targeting Som+ neurons was detected (left, based on EPSC8), but there was an increase in inhibitory drive provided by Som+ neurons (right). *P < 0.05.
FIG. 6.
FIG. 6.
Intrinsic membrane excitability of excitatory neurons is increased in Fmr1 KO mice. A: traces from excitatory neurons obtained from 4-wk-old animals showing that for a 50-pA current step, Fmr1 KO cells fire more action potentials. Scale bars: 20 mV, 200 ms. B: average data from 2- and 4-wk data groups showing that more APs occurred for each current step examined. C: in 4 wk cells, the minimum current required to evoke an action potential (threshold current) was decreased in Fmr1 KO mice. D: the increase in membrane excitability may partly be due to an increase in input resistance in Fmr1 KO cells. *P < 0.04. **P < 0.004.
FIG. 7.
FIG. 7.
Thalamically evoked UP states are longer in duration in the Fmr1 KO. A: picture showing the stimulation and recording configuration. Stimulation of thalamic axons occurred either at the thalamus (Thal), the reticular nucleus (Ret), or the internal capsule (IC). A weight was used to stabilize the experiment. In this example, a stimulation probe is seen in the reticular nucleus. Scale bar: 500 μm. B: single traces showing UP states observed in WT and KO layer 4 excitatory neurons. Each cell had barrages of both EPSCs (−60 mV) and IPSCs (+10 mV) during the UP state. ↓, onset of stimulation (≤3 pulses, 20 Hz). Vertical scale: 200 and 800 pA for −60 and +10, respectively. Horizontal scale: 200 ms. C: average duration of UP states was longer in the KO. Sample number is slice number. Right: the same data plotted as a cumulative distribution. D: EPSC and IPSC average amplitude were unchanged (measured during the 1st 400 ms). Sample number is cell number. E: the EPSC/IPSC amplitude ratio was unchanged. *P < 0.0001.
FIG. 8.
FIG. 8.
Synchrony of UP states is decreased in Fmr1 KO mice. A: UP states occurring in 2 simultaneously recorded excitatory neurons observed at +10 mV. Scale bars: 500 pA, 250 ms. B: the traces in A are filtered with a 20- to 100-Hz band-pass filter and the 1st 400 ms of the UP states from each cell are superimposed (black and red refer to top and bottom traces, respectively). Scale bars: 200 pA, 100 ms. C: cross-correlograms for the traces in B. D: an average correlogram peak is calculated for each cell pair and plotted against intercellular distance. E: data in D are averaged and reveal a 13% decrease in UP state synchrony in Fmr1 KO slices. *P < 0.004.

References

    1. Agmon A, Connors BW. Thalamocortical responses of mouse somatosensory (barrel) cortex in vitro. Neuroscience 41: 365–379, 1991. - PubMed
    1. Bakker DB Fmr1 knockout mice: a model to study fragile X mental retardation. The Dutch-Belgian Fragile X Consortium. Cell 78: 23–33, 1994. - PubMed
    1. Berry-Kravis E Epilepsy in fragile X syndrome. Dev Med Child Neurol 44: 724–728, 2002. - PubMed
    1. Braun K, Segal M. FMRP involvement in formation of synapses among cultured hippocampal neurons. Cereb Cortex 10: 1045–1052, 2000. - PubMed
    1. Brennan FX, Albeck DS, Paylor R. Fmr1 knockout mice are impaired in a leverpress escape/avoidance task. Genes Brain Behav 5: 467–471, 2006. - PubMed

Publication types

MeSH terms

Substances