

Dynamic sculpting of directional tuning in the primate motor cortex during three-dimensional reaching
- PMID: 18784297
- PMCID: PMC6670929
- DOI: 10.1523/JNEUROSCI.1898-08.2008
Dynamic sculpting of directional tuning in the primate motor cortex during three-dimensional reaching
Abstract
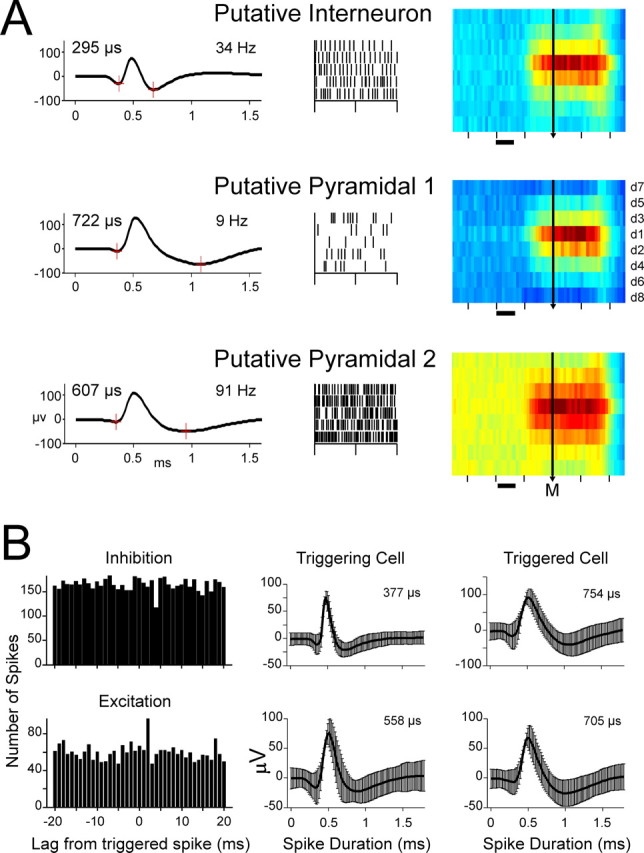
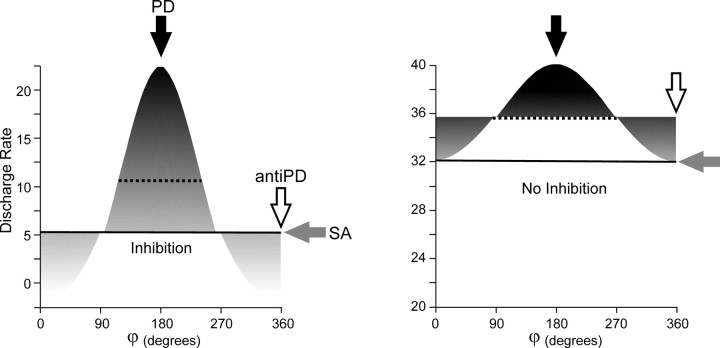
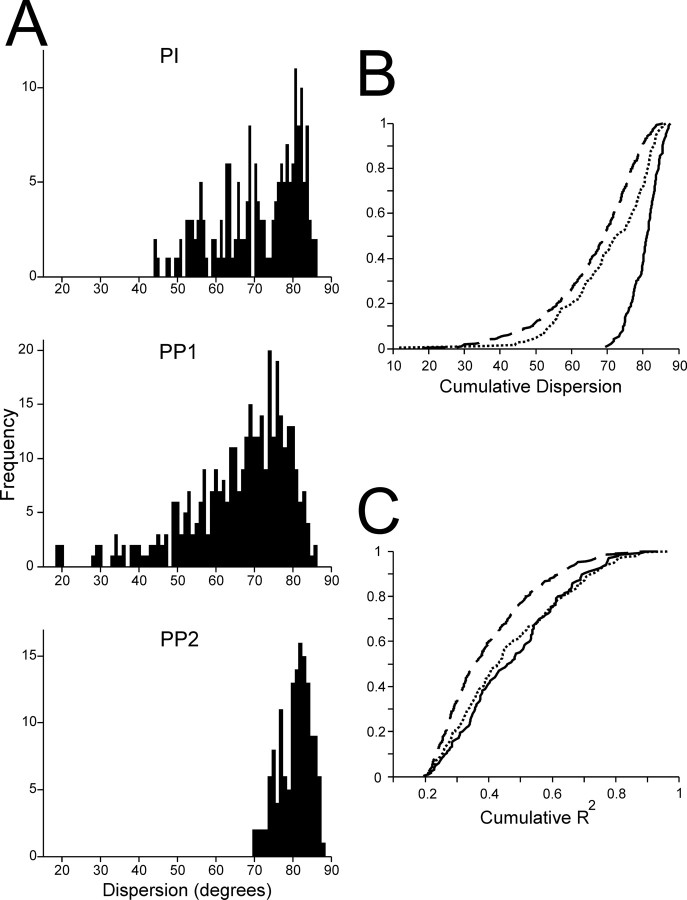
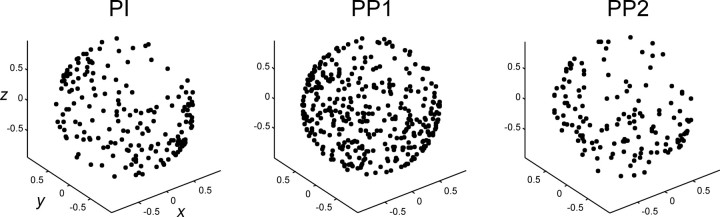
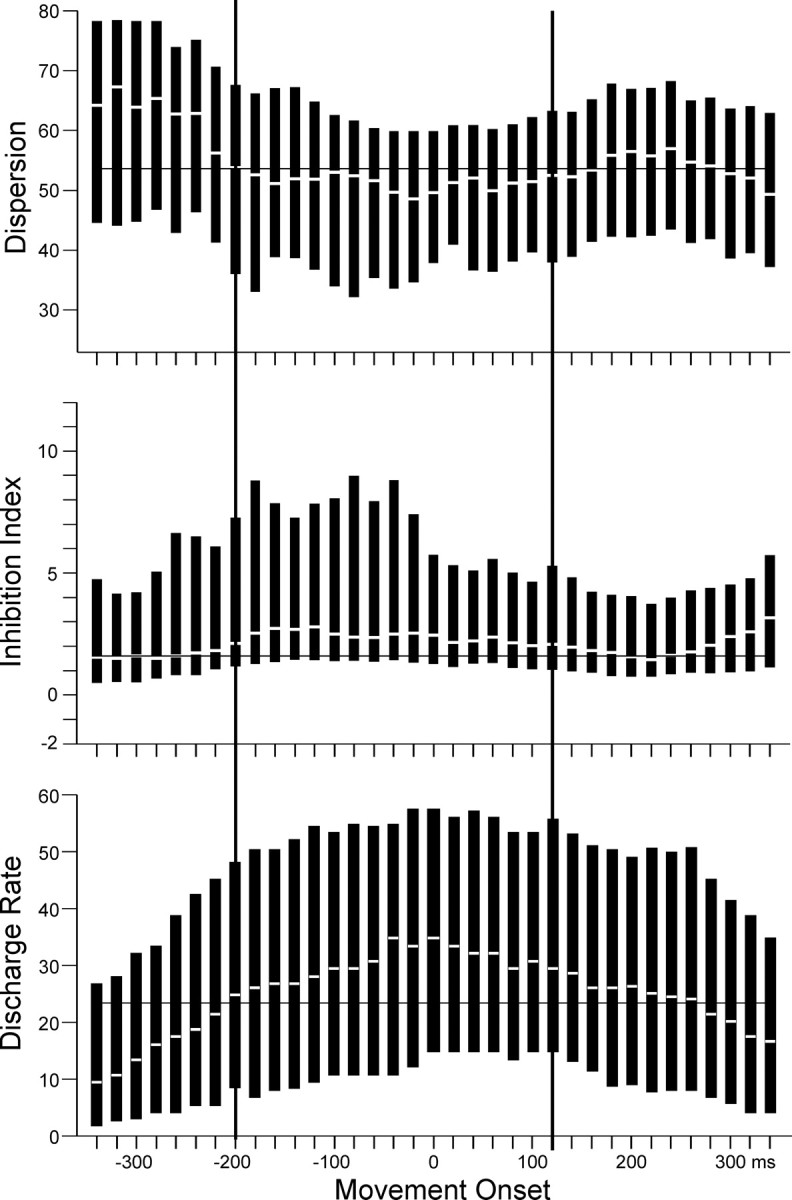
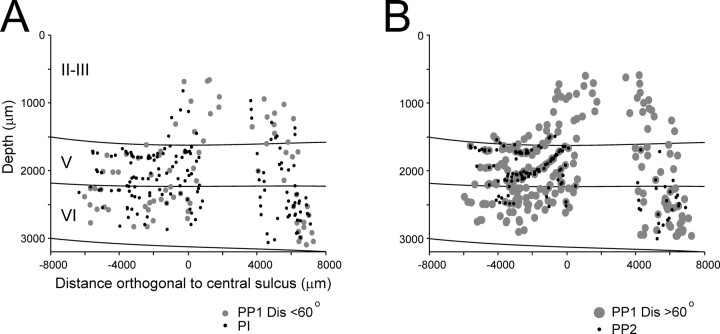
In the present study, we investigated how directional tuning of putative pyramidal cells is sharpened by inhibition from neighboring interneurons. First, different functional and electrophysiological criteria were used to identify putative pyramidal and interneuronal subtypes in a large database of motor cortical cells recorded during performance of the three-dimensional center-out task. Then we analyzed the relationship between the magnitude of inhibition and the tuning width, and a significant decrease of the latter as a function of the former was found in a population of putative pyramidal cells. In fact, the coupling of inhibition with narrow tuning was observed before and during movement execution on a cell-by-cell basis, indicating an important dynamic role of inhibition during movement control. Overall, these results suggest that local inhibition is involved in sculpting the directional specificity of a group of putative pyramidal neurons in the motor cortex.
Figures

Similar articles
-
On the relations between single cell activity in the motor cortex and the direction and magnitude of three-dimensional dynamic isometric force.Exp Brain Res. 2005 Nov;167(2):148-59. doi: 10.1007/s00221-005-0016-z. Epub 2005 Nov 15. Exp Brain Res. 2005. PMID: 16193273
-
Motor learning with unstable neural representations.Neuron. 2007 May 24;54(4):653-66. doi: 10.1016/j.neuron.2007.04.030. Neuron. 2007. PMID: 17521576
-
Neurons in Primary Motor Cortex Encode Hand Orientation in a Reach-to-Grasp Task.Neurosci Bull. 2017 Aug;33(4):383-395. doi: 10.1007/s12264-017-0126-1. Epub 2017 Apr 7. Neurosci Bull. 2017. PMID: 28389871 Free PMC article.
-
Local shaping of function in the motor cortex: motor contrast, directional tuning.Brain Res Rev. 2007 Oct;55(2):383-9. doi: 10.1016/j.brainresrev.2007.05.001. Epub 2007 May 8. Brain Res Rev. 2007. PMID: 17543390 Free PMC article. Review.
-
Functional impact of interneuronal inhibition in the cerebral cortex of behaving animals.Prog Neurobiol. 2012 Nov;99(2):163-78. doi: 10.1016/j.pneurobio.2012.08.005. Epub 2012 Sep 1. Prog Neurobiol. 2012. PMID: 22960789 Review.
Cited by
-
Motor directional tuning across brain areas: directional resonance and the role of inhibition for directional accuracy.Front Neural Circuits. 2013 May 15;7:92. doi: 10.3389/fncir.2013.00092. eCollection 2013. Front Neural Circuits. 2013. PMID: 23720612 Free PMC article. Review.
-
Recording extracellular neural activity in the behaving monkey using a semichronic and high-density electrode system.J Neurophysiol. 2016 Aug 1;116(2):563-74. doi: 10.1152/jn.00116.2016. Epub 2016 May 11. J Neurophysiol. 2016. PMID: 27169505 Free PMC article.
-
Motor cortical networks for skilled movements have dynamic properties that are related to accurate reaching.Neural Plast. 2011;2011:413543. doi: 10.1155/2011/413543. Epub 2011 Oct 9. Neural Plast. 2011. PMID: 22007332 Free PMC article.
-
From the motor cortex to the movement and back again.PLoS One. 2017 Jun 20;12(6):e0179288. doi: 10.1371/journal.pone.0179288. eCollection 2017. PLoS One. 2017. PMID: 28632736 Free PMC article.
-
Differences in motor learning-related structural plasticity of layer 2/3 parvalbumin-positive interneurons of the young and aged motor cortex.Geroscience. 2025 Jun;47(3):3611-3626. doi: 10.1007/s11357-024-01350-6. Epub 2024 Sep 30. Geroscience. 2025. PMID: 39343864 Free PMC article.
References
-
- Barthó P, Hirase H, Monconduit L, Zugaro M, Harris KD, Buzsáki G. Characterization of neocortical principal cells and interneurons by network interactions and extracellular features. J Neurophysiol. 2004;92:600–608. - PubMed
-
- Blanche TJ, Spacek MA, Hetke JF, Swindale NV. Polytrodes: high-density silicon electrode arrays for large-scale multiunit recording. J Neurophysiol. 2005;93:2987–3000. - PubMed
-
- Connors BW, Gutnick MJ. Intrinsic firing patterns of diverse neocortical neurons. Trends Neurosci. 1990;13:99–104. - PubMed
Publication types
MeSH terms
Grants and funding
LinkOut - more resources
Full Text Sources