. 2008 Sep 10;28(37):9183-93.
doi: 10.1523/JNEUROSCI.1936-08.2008.

Adaptation of velocity encoding in synaptically coupled neurons in the fly visual system

Affiliations

Adaptation of velocity encoding in synaptically coupled neurons in the fly visual system

Julia Kalb et al. J Neurosci. .

Abstract

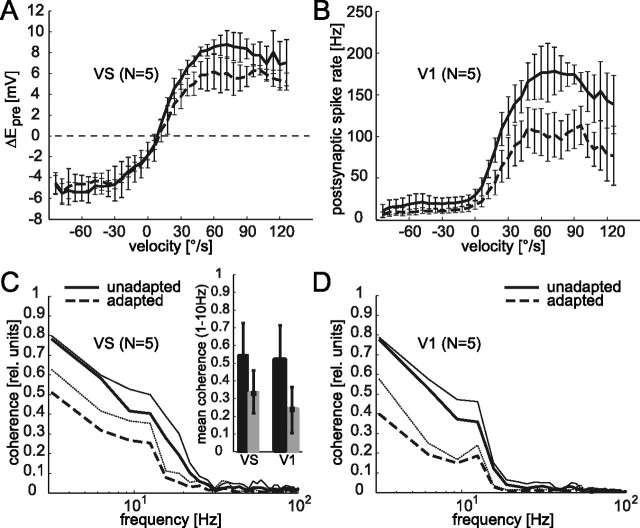
Although many adaptation-induced effects on neuronal response properties have been described, it is often unknown at what processing stages in the nervous system they are generated. We focused on fly visual motion-sensitive neurons to identify changes in response characteristics during prolonged visual motion stimulation. By simultaneous recordings of synaptically coupled neurons, we were able to directly compare adaptation-induced effects at two consecutive processing stages in the fly visual motion pathway. This allowed us to narrow the potential sites of adaptation effects within the visual system and to relate them to the properties of signal transfer between neurons. Motion adaptation was accompanied by a response reduction, which was somewhat stronger in postsynaptic than in presynaptic cells. We found that the linear representation of motion velocity degrades during adaptation to a white-noise velocity-modulated stimulus. This effect is caused by an increasingly nonlinear velocity representation rather than by an increase of noise and is similarly strong in presynaptic and postsynaptic neurons. In accordance with this similarity, the dynamics and the reliability of interneuronal signal transfer remained nearly constant. Thus, adaptation is mainly based on processes located in the presynaptic neuron or in more peripheral processing stages. In contrast, changes of transfer properties at the analyzed synapse or in postsynaptic spike generation contribute little to changes in velocity coding during motion adaptation.


Figures

Figure 1.
Figure 1.
Adaptation of presynaptic VS cells and postsynaptic V1 cells during ongoing velocity-modulated motion. A, Average response profiles of an example dual recording of a presynaptic VS cell (top) and the postsynaptic V1 cell (bottom) during motion adaptation. The cells were adapted with a motion stimulus consisting of six identical consecutive velocity-modulated motion sequences. The responses were averaged over 13 presentations of the adapting stimulus. B, Section of the presynaptic and postsynaptic average responses based on the first (referred to as unadapted; black lines) and the sixth (referred to as adapted; gray lines) repetition of the single motion trials. Responses were elicited by the stimulus segment shown below. The corresponding time windows within the entire adapting motion stimulus are marked by shaded areas in A.
Figure 2.
Figure 2.
Adaptation of VS and V1 during ongoing constant-velocity motion. Mean responses of separately recorded 12 VS cells (thick black line; n = 2.0 ± 0.6 stimulus presentations, mean ± SD) and 9 V1 cells (thick gray line; n = 21.6 ± 3.4 stimulus presentations, mean ± SD) to a 24 s adapting constant-velocity motion stimulus. The thin lines show the SDs of the presynaptic (thin black line) and the postsynaptic responses (thin gray line) below and above the corresponding mean traces, respectively.
Figure 3.
Figure 3.
Time course of adaptation during presentation of constant-velocity and velocity-fluctuated motion. Relative reduction of response amplitudes of VS and V1 cells induced by adaptation with dynamic (solid lines) and constant (dashed lines) motion. To account for the rectification imposed by the spike-generation process inherent in V1 cells, the evaluation of mean responses during adaptation with dynamic motion was restricted to time periods of preferred-direction motion. For constant motion adaptation, time windows of equal size were included in the analysis. Each point in the data curves corresponds to mean responses pooled over all cells and is shown together with the respective SD. In case of dynamic motion adaptation, two different stimuli with identical statistical properties were used (see Materials and Methods). Responses were averaged over 13 consecutive presentations of each of the two dynamic adapting stimuli and then averaged over five dual VS–V1 recordings. The data based on constant motion adaptation are obtained from the responses illustrated in Figure 2. All data were normalized to the mean responses in the unadapted state. We defined the unadapted state as the time period during the first presentation of the dynamic motion sequence.
Figure 4.
Figure 4.
Impact of motion adaptation on the relationship between presynaptic and postsynaptic responses. The data analysis is based on five simultaneously recorded cell pairs. A, Signal transfer gain expressed as the mean and the SD of the postsynaptic spike rate as a function of the presynaptic membrane potential obtained from unadapted (solid line) and adapted (dashed line) states. The presynaptic voltage traces were subdivided into 0.5 mV classes, and, for each instant of time, the postsynaptic spike rate was assigned to the corresponding presynaptic voltage class. The thin solid and dashed lines show the number of events per analyzed class of presynaptic voltage in the unadapted and in the adapted state, respectively (plotted on right axis; note the inverted axis orientation). Data were averaged over all five cell pairs. B, The similarity between presynaptic membrane potentials and postsynaptic spike responses was quantified by the coherence analysis. The coherence values indicate to what extent the presynaptic signal can be reconstructed by convolution of the postsynaptic spike train with a linear filter. Coherence values close to 1 reflect that the corresponding frequency component of the presynaptic membrane fluctuations is linearly and reliably transformed into postsynaptic spike activities. Coherence values were averaged over all cell pairs. In the adapted state (thick dashed line), the coherences of slow frequencies of up to 10 Hz is slightly reduced compared with the unadapted (thick solid line) state. The SDs for the unadapted values (thin solid line) and the adapted values (thin dashed line) are plotted above and below the corresponding mean trace, respectively. C, The mean coherence in the low-frequency range up to 10 Hz is plotted through the course of dynamic motion adaptation. Each data point denotes the mean and the SD of corresponding coherences from the first to the sixth repetition of the dynamic motion sequence. Note the difference in axis scaling between B and C.
Figure 5.
Figure 5.
Stimulus representation by presynaptic VS cells and postsynaptic V1 cells. A, B, Velocity tuning averaged over unadapted (solid line, mean ± SD) and adapted (dashed line, mean ± SD) presynaptic and postsynaptic cells obtained from all five dual recordings. The motion sequence was subdivided into velocity classes of 6°/s, and the velocity tuning is illustrated as the mean response elicited by a certain velocity class. In accordance with the stronger response attenuation of postsynaptic V1 cells compared with VS (Fig. 3), the adaptation-induced compression of the velocity-tuning curve was also stronger in V1 cells. The dashed horizontal line in A indicates zero level to facilitate the comparison between A and B. C, D, Representation of stimulus velocity in unadapted and adapted responses of VS and V1 cells (shown in C and D, respectively) assessed by the coherence analysis. Here, the velocity of the dynamic motion stimulus was reconstructed from both unadapted (solid lines) and adapted (dashed lines) responses. Coherence values were averaged over all cells. For reasons of clarity, corresponding SDs (thin lines) are plotted only above the mean traces. The inset in C illustrates mean coherences restricted to the slow frequency range of up to 10 Hz (black bar, unadapted; gray bar, adapted). The adaptation-induced decrease of linear representation of slow-frequency fluctuations in motion velocity was more pronounced in postsynaptic V1 than in presynaptic VS cells.
Figure 6.
Figure 6.
Contribution of noise to adaptation-induced changes in stimulus representation. A, B, The mean expected coherence of presynaptic (A) and postsynaptic (B) cells was quantified as the coherence between individual neuronal responses and their corresponding noise-free averaged stimulus-induced response component. Expected coherences did not change as a result of dynamic motion adaptation (compare solid with dashed curves). Thus, motion adaptation did not increase the noise in the system. Corresponding SDs (thin lines) are plotted in opposite directions. C, D, The coherence between single adapted responses and the corresponding mean response in the unadapted state (dashed lines) is shown (C, VS cells; D, V1 cells). For comparison, the expected coherence in the unadapted state is redrawn (solid lines, identical to those shown in A, D). Because adaptation did not increase the noise, the reduction in coherence values can be attributed to an increase in nonlinearities. E, F, The mean noise spectra for the unadapted state (solid lines) and the adapted state (dashed lines) are shown (E, VS cells; F, V1 cells; SDs shown above the mean traces by the corresponding thin lines).
Figure 7.
Figure 7.
Influence of spike rate on velocity encoding. A, To test whether a reduction of spike rate affects the linear representation of motion velocity, 20, 30, or 50% of the spikes were randomly deleted from the spike trains recorded from five V1 cells (same cells as in Figs. 4–6) in the unadapted state during presentation of velocity fluctuations. Artificial spike rate reduction led to a decrease in the mean coherence functions (different dashed and dotted lines) relative to the original traces from the unadapted cells (solid line, replotted from Fig. 5D). B, Coherence for the V1 cells in the unadapted state (solid black line, replotted from A, with SD plotted above) and the adapted state (gray line with SD plotted below, replotted from Fig. 5D) and for the manipulated dataset obtained by randomly deleting 50% of the spikes from unadapted spike trains (dashed line with SD plotted above), thus reaching a similar activity level as after adaptation. C, Expected coherence in the unadapted state (solid black line with SD plotted above, replotted from Fig. 6B) and for the dataset manipulated to reach a 50% reduction in spike rate (dashed line, with SD plotted below). Unlike adaptation the artificial reduction in spike rate led to a decline in the coherence (compare the dashed line with the gray line, replotted from Fig. 6B).
Figure 8.
Figure 8.
Impact of adaptation on sensitivity to acceleration. For the analysis, the stimulus was divided into six velocity classes, each covering a range of 10°/s. The lowest velocity class ranged from 0 to 10°/s, and the highest velocity class ranged from 50 to 60°/s. For each velocity class, the acceleration values were divided into two equally sized groups of high or low accelerations. The relative neuronal sensitivity of VS and V1 cells (shown in A and B, respectively) to stimulus acceleration was assessed by the ratio of the adaptation-induced decrease of responses elicited by high accelerations to the decrease of responses elicited by low accelerations (see Materials and Methods). A ratio of 1 (indicated by the dashed line) indicates that there is no difference between adaptation-induced response attenuation at high and low accelerations. Ratios below 1 reveal a stronger response reduction at low acceleration compared with the attenuation at high acceleration. Two different dynamic adapting stimuli with identical statistical properties were used (see Materials and Methods). The results obtained with the two stimuli were analyzed separately, illustrated as open and filled data symbols. For the evaluation, data of additional five V1 neurons that were not recorded together with VS neurons were included. Different symbols denote data from different cells. In B, asterisks mark columns of data that are significantly smaller than 1, whereas nonsignificant data columns are marked by a dash (one-sided sign test, p < 0.05). Box whisker plots show the distribution of the ratios: the horizontal lines of the boxes indicate the upper quartile, median, and lower quartile values. Whiskers show the extent of the rest of the data.

Similar articles

Cited by

References

    1. Beckers U, Egelhaaf M, Kurtz R. Synapses in the fly motion-vision pathway: evidence for a broad range of signal amplitudes and dynamics. J Neurophysiol. 2007;97:2032–2041. - PubMed
    1. Borst A, Egelhaaf M. Temporal modulation of luminance adapts time constant of fly movement detectors. Biol Cybern. 1987;56:209–215.
    1. Borst A, Haag J. Effects of mean firing on neural information rate. J Comput Neurosci. 2001;10:213–221. - PubMed
    1. Borst A, Reisenman C, Haag J. Adapation of response transients in fly motion vision. II. Model studies. Vision Res. 2003;43:1311–1324. - PubMed
    1. Borst A, Flanagin VL, Sompolinsky H. Adaptation without parameter change: dynamic gain control in motion detection. Proc Natl Acad Sci U S A. 2005;102:6172–6176. - PMC - PubMed

Publication types

LinkOut - more resources