. 2008 Sep 10;28(37):9239-48.
doi: 10.1523/JNEUROSCI.1929-08.2008.

Hierarchical organization of human cortical networks in health and schizophrenia

Affiliations

Hierarchical organization of human cortical networks in health and schizophrenia

Danielle S Bassett et al. J Neurosci. .

Abstract

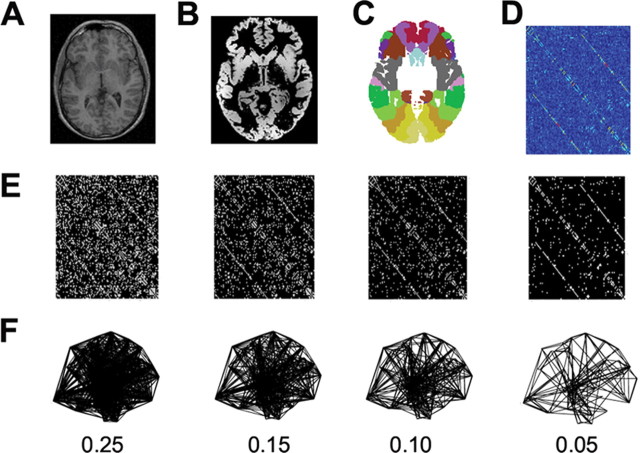
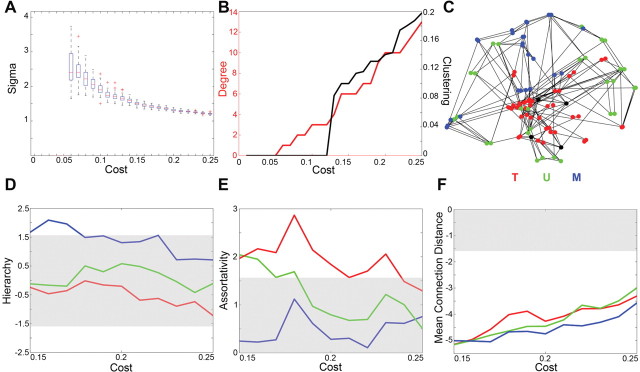
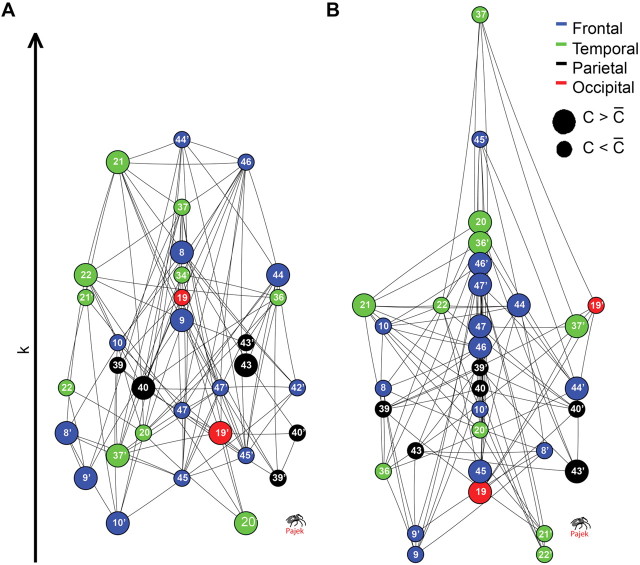
The complex organization of connectivity in the human brain is incompletely understood. Recently, topological measures based on graph theory have provided a new approach to quantify large-scale cortical networks. These methods have been applied to anatomical connectivity data on nonhuman species, and cortical networks have been shown to have small-world topology, associated with high local and global efficiency of information transfer. Anatomical networks derived from cortical thickness measurements have shown the same organizational properties of the healthy human brain, consistent with similar results reported in functional networks derived from resting state functional magnetic resonance imaging (MRI) and magnetoencephalographic data. Here we show, using anatomical networks derived from analysis of inter-regional covariation of gray matter volume in MRI data on 259 healthy volunteers, that classical divisions of cortex (multimodal, unimodal, and transmodal) have some distinct topological attributes. Although all cortical divisions shared nonrandom properties of small-worldness and efficient wiring (short mean Euclidean distance between connected regions), the multimodal network had a hierarchical organization, dominated by frontal hubs with low clustering, whereas the transmodal network was assortative. Moreover, in a sample of 203 people with schizophrenia, multimodal network organization was abnormal, as indicated by reduced hierarchy, the loss of frontal and the emergence of nonfrontal hubs, and increased connection distance. We propose that the topological differences between divisions of normal cortex may represent the outcome of different growth processes for multimodal and transmodal networks and that neurodevelopmental abnormalities in schizophrenia specifically impact multimodal cortical organization.


Figures

Figure 1.
Figure 1.
Schematic of procedure to construct human whole-brain anatomical networks. Top row, Structural MR images (A) are segmented by a tissue classification algorithm to produce maps of gray matter (B) that are then multiplied by a regionally parcellated template image (C) to estimate regional gray matter volume in each of 104 brain regions. The partial correlation of regional gray matter volume is estimated for each possible pair of regions and compiled in a {104 × 104} inter-regional partial correlation matrix (D). Middle row, Various thresholds can be applied to generate adjacency matrices of variable sparseness from the partial correlation matrix (E). Bottom row, The adjacency matrices are visualized as undirected graphs or networks by plotting each region as a node in anatomical space (using the x and z coordinates of the regional centroid in Montreal Neurological Institute space) and drawing an edge between regions that have strongly correlated gray matter densities (non-zero elements in the adjacency matrix) (F). Results are shown for networks with costs in the range 0.25 ≥ K ≥ 0.05.
Figure 2.
Figure 2.
Organization of normal human brain anatomical networks in the small-world regime. A, Small-world metric, σ, in the cost range 0.05 < K < 0.25 showing that the mean value of σ ≥ 1.2 when K < 0.25. B, Minimum degree k (red) and minimum clustering C (black) of the whole-brain networks as functions of cost showing that clustering or degree of some nodes is 0 when K < 0.15. C, Anatomical representation of a sparsely thresholded network showing regional nodes color coded according to their membership of classical cortical divisions: transmodal (red), unimodal (green), and multimodal (blue). Z-scores for hierarchy coefficients (β; in D), degree correlation or assortativity (r; in E), and mean connection distance (d; in F) for the three cortical networks as a function of cost in the small-world regime; gray areas indicate the 80% confidence interval for the parameters estimated in comparable random graphs (−1.65 < Z < 1.65).
Figure 3.
Figure 3.
Effects of schizophrenia on organization of the multimodal cortical network. Top row, Hierarchy coefficients (β; in A), degree correlation or assortativity (r; in B), and mean connection distance (d; in C) as functions of cost in the small-world regime for healthy volunteers (black lines) and people with schizophrenia (red lines). Middle and bottom rows, Between-group differences in regional degree (k; in D, G), clustering (C; in E, H), and betweenness centrality (Bc; in F, I). In the middle row, regional differences are represented anatomically in the context of a sparsely thresholded whole-brain network; red nodes have significantly greater hub criteria, and black nodes have significantly smaller hub criteria, in people with schizophrenia. The size of the node is inversely proportional to the p value of the between-group difference. In the bottom row, the red and black bars represent the rank-ordered and anatomically labeled p values for the 10 most significant between-group differences in each of the hub criteria.
Figure 4.
Figure 4.
Graphical visualization of multimodal network hierarchy in healthy volunteers (A) and people with schizophrenia (B). Nodes are ordered according to their degree (y-axis). Size of nodes indicates greater than (large) or less than (small) average clustering. Color of the nodes indicates lobe location: frontal (blue), temporal (green), parietal (black), or occipital (red). Lettering indicates approximate Brodmann area, and the ′ denotes left-sided regions. Note that highly clustered nodes are concentrated at the bottom of the normal hierarchy, which is dominated by highly connected nodes (many of them frontal) with low clustering; conversely, in people with schizophrenia, highly clustered nodes are more evenly distributed in terms of their degree, and frontal hubs are less prominent.

Similar articles

Cited by

References

    1. Achard S, Bullmore ET. Efficiency and cost of economical brain functional networks. PLoS Comput Biol. 2007;3:e17. - PMC - PubMed
    1. Achard S, Salvador R, Whitcher B, Suckling J, Bullmore E. A resilient, low-frequency, small-world human brain functional network with highly connected association cortical hubs. J Neurosci. 2006;26:63–72. - PMC - PubMed
    1. Aftabuddin M, Kundu S. Hydrophobic, hydrophilic, and charged amino acid networks within protein. Biophys J. 2007;93:225–231. - PMC - PubMed
    1. Barrat A, Barthélemy M, Pastor-Satorras R, Vespignani A. The architecture of complex weighted networks. Proc Natl Acad Sci USA. 2004;101:3747–3752. - PMC - PubMed
    1. Bassett DS, Bullmore E. Small-world brain networks. Neuroscientist. 2006;12:512–523. - PubMed

Publication types