. 2008 Sep 10;28(37):9297-308.
doi: 10.1523/JNEUROSCI.1879-08.2008.

Protein kinase d regulates trafficking of dendritic membrane proteins in developing neurons

Affiliations

Protein kinase d regulates trafficking of dendritic membrane proteins in developing neurons

Mariano Bisbal et al. J Neurosci. .

Abstract

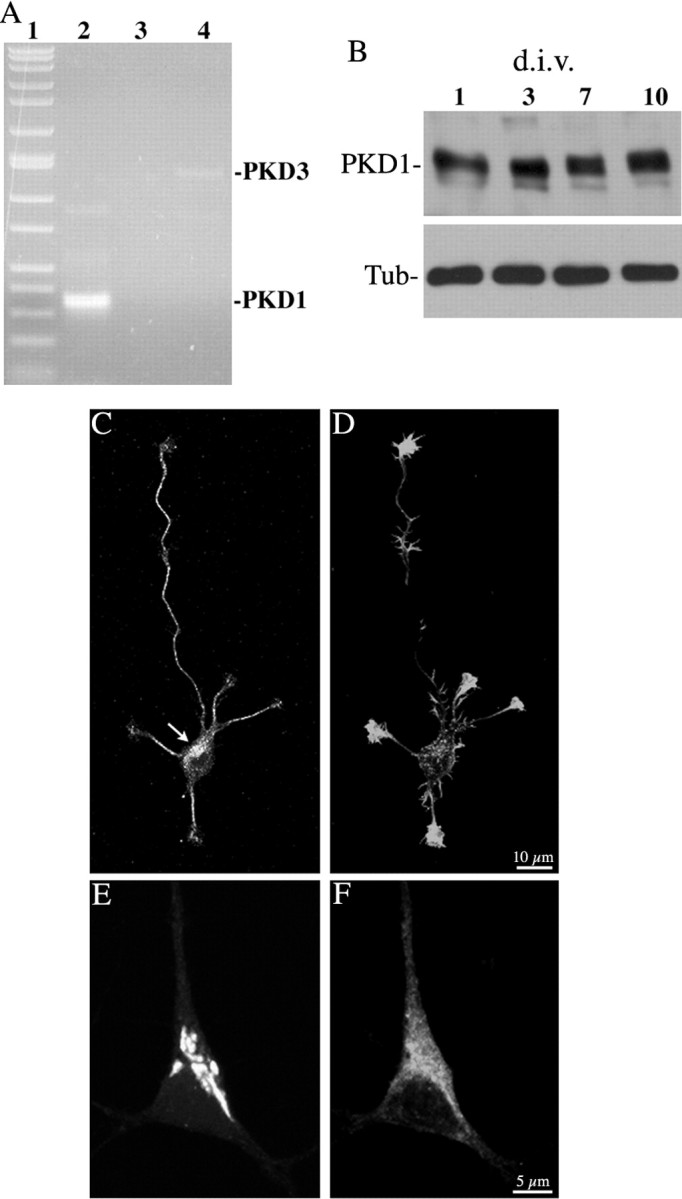
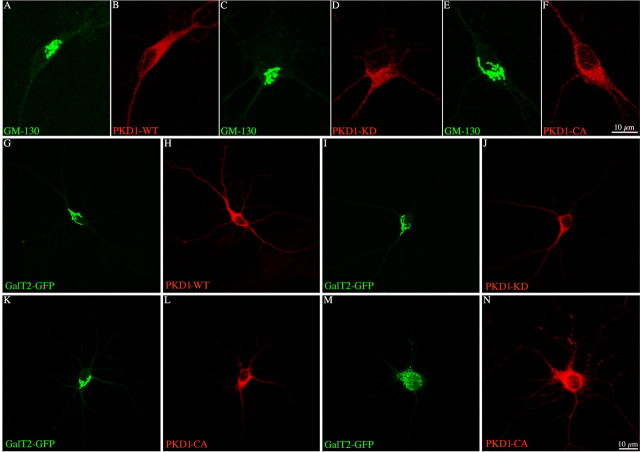
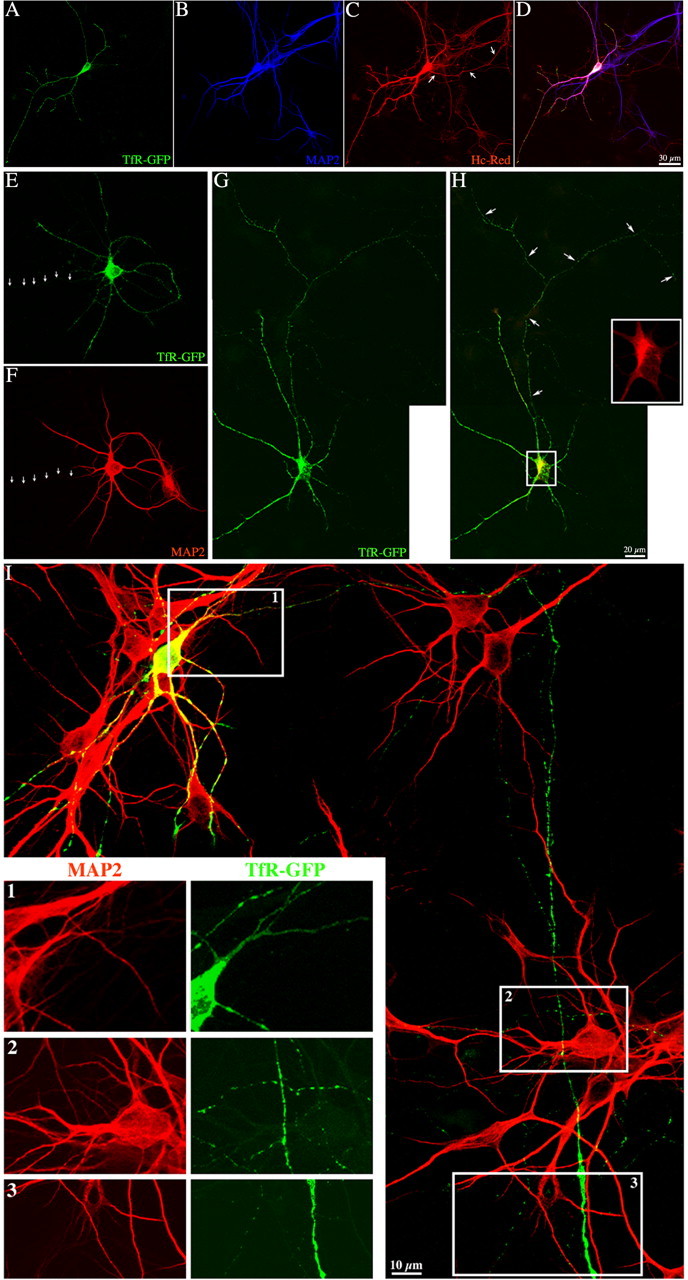
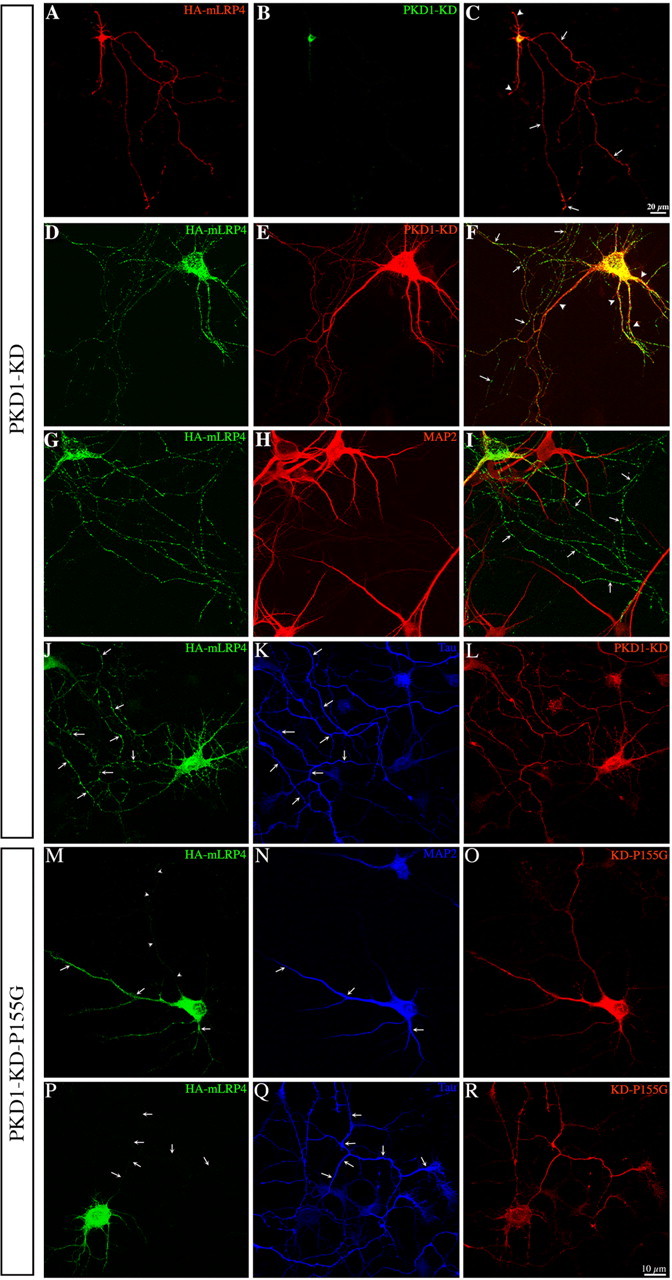
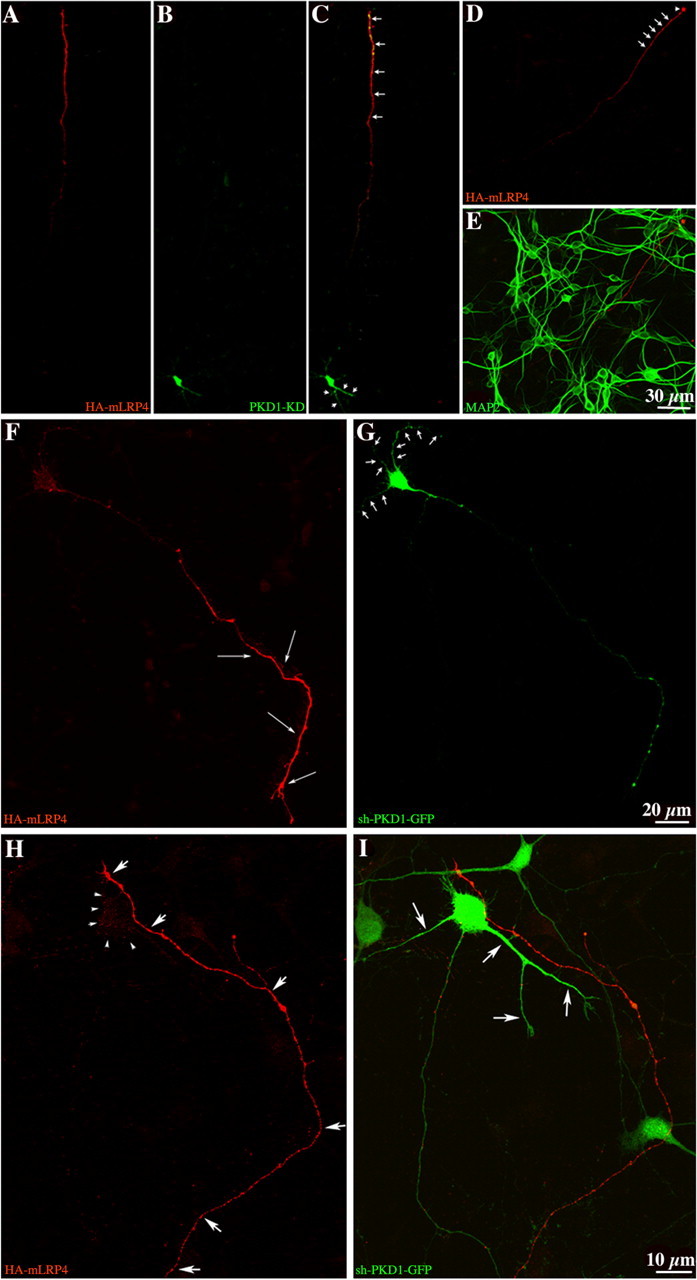
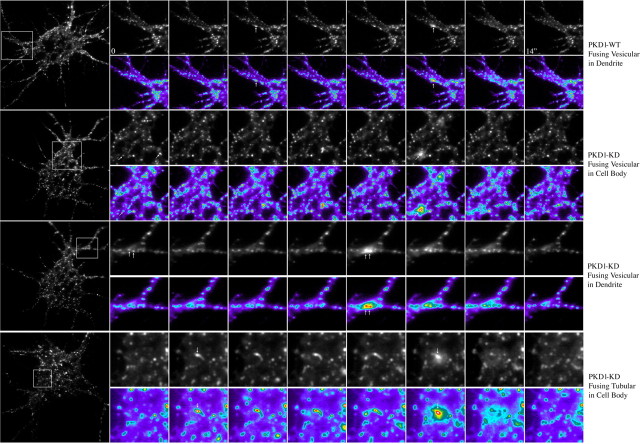
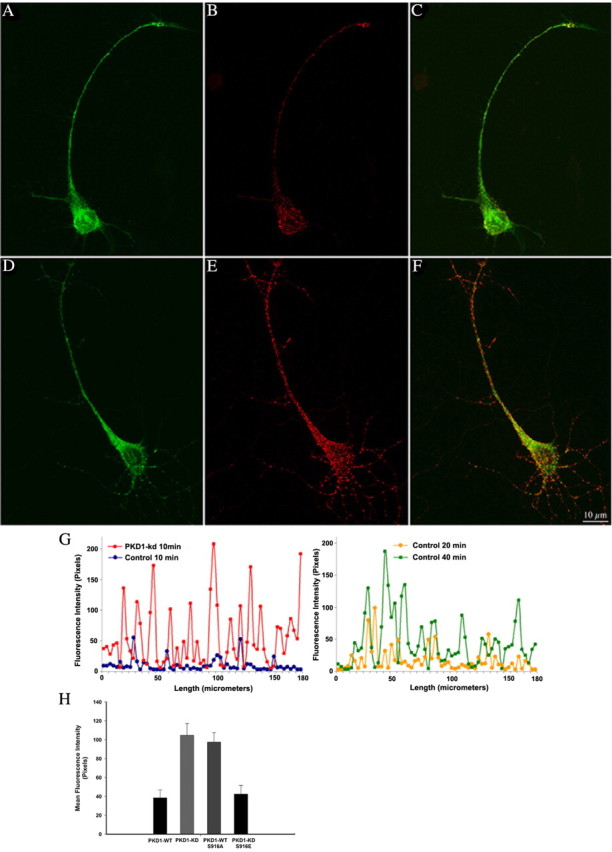
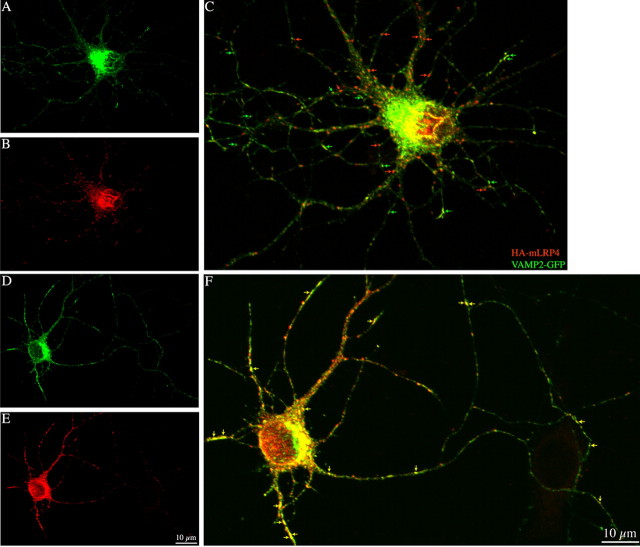
In non-neuronal cells, inactivation of protein kinase D (PKD) blocks fission of trans-Golgi network (TGN) transport carriers, inducing the appearance of long tubules filled with cargo. We now report on the function of PKD1 in neuronal protein trafficking. In cultured hippocampal pyramidal cells, the transferrin receptor (TfR) and the low-density receptor-related protein (LRP) are predominantly transported to dendrites and excluded from axons. Expression of kinase-inactive PKD1 or its depletion by RNA interference treatment dramatically and selectively alter the intracellular trafficking and membrane delivery of TfR- and LRP-containing vesicles, without inhibiting exit from the TGN or inducing Golgi tubulation. After PKD1 suppression, dendritic membrane proteins are mispackaged into carriers that transport VAMP2; these vesicles are distributed to both axons and dendrites, but are rapidly endocytosed from dendrites and preferentially delivered to the axonal membrane. A kinase-defective mutant of PKD1 lacking the ability to bind diacylglycerol and hence its Golgi localization does not cause missorting of TfR or LRP. These results suggest that in neurons PKD1 regulates TGN-derived sorting of dendritic proteins and hence has a role in neuronal polarity.


Figures

Figure 1.
Figure 1.
A, RT-PCR analysis monitoring PKD1 (lane 2), PKD2 (lane 3), and PKD3 (lane 4) expression on RNA extracts obtained from 7 d.i.v. hippocampal cell cultures. Lane 1 represents molecular weight markers. B, Western blot showing PKD1 and β-tubulin expression in cell extracts obtained at 1, 3, 7, and 10 d.i.v. Ten micrograms of total cellular protein were loaded in each lane. C, D, Confocal images showing the distribution of endogenous PKD1 (C) and F-actin (D) in a stage 3 cultured hippocampal pyramidal neuron. Note the prominent PKD1 staining of the Golgi region (C, arrow). The culture was fixed 30 h after plating and stained with the PKD1 antibody used at a dilution of 1:250. E, F, High-power confocal micrographs showing the distribution of ectopically expressed GalT2-GFP (E) and GST-PKD1-KD (F) in a hippocampal pyramidal neuron.
Figure 2.
Figure 2.
A–F, Confocal images showing the morphology of the Golgi complex in neurons labeled with an antibody against the cis-Golgi marker GM-130 and transfected with GST-tagged PKD1-WT, -KD, or -CA. G–N, Equivalent images but from neurons cotransfected with GalT2-GFP. Note the normal morphology of the Golgi complex after expression of the PKD1 constructs. Also note that high expression levels of PKD1-CA result in Golgi vesiculation (M, N). For this experiment, neurons (8 d.i.v.) were transfected with Lipofectamine 2000 and analyzed by immunofluorescence 12–14 h later.
Figure 3.
Figure 3.
Expression of PKD1-KD alters the intracellular distribution of TfR-GFP. A–D, Confocal images showing the distribution of TfR-GFP and MAP2 in an 8 d.i.v. hippocampal pyramidal neuron cotransfected with Hc-Red. Note that the distribution of TfR-GFP mimics that of MAP2, whereas Hc-Red illuminates the entire neuritic arbor of the transfected cell; also note that the axon emerging from the cell body (C, arrows) is completely devoid of TfR-GFP and MAP2 labeling. E, F, Confocal images showing another example of the distribution of TfR-GFP. Note that in this case the axon (arrows) originates from a MAP2+ dendrite. G, Confocal image showing the distribution of TfR-GFP in an 8 d.i.v. hippocampal pyramidal neuron coexpressing GST-PKD1-KD. H, Merged image showing coexpression of TfR-GFP and GST-PKD1-KD (yellow). Inset (red), High-magnification view of the GST-staining in the Golgi region. Note that after coexpression of GST-PKD-KD, TfR-GFP localized to both dendrites and axon-like neurites (arrows). I, High-power confocal merged image showing that TfR-GFP (green) localizes to MAP2+ dendrites (red) and MAP2− axon-like neurites after coexpression of GST-PKD1-KD (data not shown). 1–3, High-magnification views of the boxes shown in I. Note the presence of TfR-GFP labeling in the MAP2− axon that arises from the transfected neuron.
Figure 4.
Figure 4.
Expression of PKD1-KD alters the intracellular distribution of HA-mLRP4. A–C, Confocal images showing the intracellular distribution of HA-mLRP4 in a 7 d.i.v. neuron transfected with GST-tagged PKD1-KD; note that the HA staining localized to both long axon-like (arrows) and short dendritic-like (arrowheads) neurites. D, E, High-power confocal images showing the distribution of HA-mLRP4 in a neuron expressing GST-PKD1-KD. The image showing GST staining in E has been overexposed to visualize the whole extent of the neuritic arbor. F, Merged image showing that HA staining is found in both axon-like (arrows) and dendritic-like (arrowheads) processes. G, H, Confocal images showing the distribution of HA-mLRP4 and MAP2 in a neuron cotransfected with GST-PKD1-KD (data not shown). I, Merged image showing that HA staining is not only found in dendrites but also in MAP2− axons (arrows). J–L, Confocal images showing the distribution of HA-mLRP4 and Tau in a neuron cotransfected with GST-PKD1-KD. Note that HA staining is found in Tau1+ axons (arrows). M–O, Confocal images showing the distribution of HA-mLRP4 and MAP2 in a neuron cotransfected with a PKD1-KD mutant (P155G) that does not localize to the Golgi apparatus. Note that HA staining is only found in MAP2+ dendrites (arrows) but absent from the axon (arrowheads). P–R, Confocal images showing the distribution of HA-mLRP4 and Tau in a neuron cotransfected with the PKD1-KD mutant P155G (red). Note that HA staining is absent from Tau1+ axons (arrows).
Figure 5.
Figure 5.
Expression of PKD1-KD or shRNA suppression of PKD1 alters the surface distribution of HA-mLRP4. A–C, Confocal images showing the surface distribution of HA-mLRP4 in a 7 d.i.v. neuron transfected with GST-tagged PKD1-KD; note that most of the HA staining localized to the distal end of the axon (C, arrows). D, E, Confocal images showing the distribution of surface HA-mLRP4 and intracellular MAP2. Note that the HA+ neurite (arrows) and its growth cone (arrowhead) do not stain for MAP2; the cell body of the transfected neuron is out of the field of focus. F, G, Confocal images showing the surface distribution of HA-mLRP4 in a 7 d.i.v. neuron transfected with the sh-PKD1-GFP. Note the intense labeling of the axonal surface (long arrows in F) and the absence of dendritic (G, arrows) staining. H, I, High-power confocal images showing the lack of somatodendritic HA surface staining (H, arrowheads; I, long arrows) in a neuron coexpressing HA-mLRP4 and the sh-PKD1-GFP. Note that the distal end of the axon from the cotransfected neuron has prominent HA staining (H, short arrows). For all these experiments, fixed cultures were labeled with the HA antibody before detergent extraction.
Figure 6.
Figure 6.
Time-lapse TIRFM images showing examples of fusion events in hippocampal pyramidal neurons transfected with TfR-GFP plus PKD1-WT (top) or -KD (all other panels). The left images show low-magnification TIRFM views of the selected neurons; the insets correspond to the areas shown at high magnification in the time-series panels. Vesicles or tubules (“comet-like”) that undergo fusion are marked with arrows. Images were taken every 2 s, for at least 2 min.
Figure 7.
Figure 7.
Antibody uptake as a measure of endocytosis. If endocytosis of the ectopic proteins occurs during exposure of living cells to antibodies in the culture medium, some antibodies will be trapped in endosomes. These trapped antibodies will be detected by fluorescence-labeled secondary antibodies only if membranes are permeabilized after fixation. A–F, Confocal images showing endocytosis of TfR-GFP from the dendritic cell surface. Cultures transfected with TfR-GFP plus PKD1-WT (A–C) or -KD (D–F) were exposed to antibodies against the extracellular fluorescent protein tag for 10 min at 37°C before fixation. Note the numerous, brightly fluorescent puncta detected in the dendrite of the PKD1-KD-expressing neuron. In contrast, very few endocytic puncta are detected after expression of PKD1-WT. For this experiment, neurons (8 d.i.v.) were transfected and exposed to the GFP antibody 15–18 h later. G, Graphs showing quantification of GFP-antibody uptake in control nontransfected neurons or PKD1-KD-expressing neurons. Living neurons were exposed to primary antibody for 10, 20, or 40 min. For this experiment, the relative intensity of GFP fluorescence was measured pixel by pixel in a region extending from the base to the tip of dendritic processes. H, Bars showing anti-GFP average fluorescence intensities along dendritic segments (100 μm in length) from neurons transfected with PKD1-WT, -KD, -WT S916A, and -KD S916E. Ten cells (∼50–60 dendritic segments) were measured for each experimental condition. Note the increase in antibody uptake (10 min exposure) in neurons expressing PKD1-KD and PKD1-WT S916A. Error bars represent SEM.
Figure 8.
Figure 8.
A–F, Spectral confocal images showing the distribution of HA-mLRP4 and VAMP2-GFP in hippocampal neurons coexpressing PKD1-WT (A–C) or KD (D–F). Note the extensive colocalization of HA- and GFP-labeled vesicles after expression of the kinase-inactive mutant (F, yellow arrows); very little colocalization is observed in the neuron that coexpresses PKD1-WT (C, red and green arrows).

Similar articles

Cited by

References

    1. Bagowski CP, Stein-Gerlach M, Choidas A, Ullrich A. Cell-type specific phosphorylation of threonines T654 and T669 by PKD defines the signal capacity of the EGF receptor. EMBO J. 1999;18:5567–5576. - PMC - PubMed
    1. Baron CL, Malhotra V. Role of diacylglycerol in PKD recruitment to the TGN and protein transport to the plasma membrane. Science. 2002;295:325–328. - PubMed
    1. Bossard C, Bresson D, Polishchuk RS, Malhotra V. Dimeric PKD regulates membrane fission to form transport carriers at the TGN. J Cell Biol. 2007;179:1123–1131. - PMC - PubMed
    1. Bowden ET, Barth M, Thomas D, Glazer RI, Mueller SC. An invasion-related complex of cortactin, paxillin and PKCmu associates with invadopodia at sites of extracellular matrix degradation. Oncogene. 1999;18:4440–4449. - PubMed
    1. Burack MA, Silverman MA, Banker G. The role of selective transport in neuronal polarity sorting. Neuron. 2000;26:465–472. - PubMed

Publication types

MeSH terms

LinkOut - more resources