. 2008 Nov;295(5):C1183-90.
doi: 10.1152/ajpcell.00075.2008. Epub 2008 Sep 10.

Uric acid decreases NO production and increases arginase activity in cultured pulmonary artery endothelial cells

Affiliations

Uric acid decreases NO production and increases arginase activity in cultured pulmonary artery endothelial cells

Sergey Zharikov et al. Am J Physiol Cell Physiol. 2008 Nov.

Abstract

Elevated levels of serum uric acid (UA) are commonly associated with primary pulmonary hypertension but have generally not been thought to have any causal role. Recent experimental studies, however, have suggested that UA may affect various vasoactive mediators. We therefore tested the hypothesis that UA might alter nitric oxide (NO) levels in pulmonary arterial endothelial cells (PAEC). In isolated porcine pulmonary artery segments (PAS), UA (7.5 mg/dl) inhibits acetylcholine-induced vasodilation. The incubation of PAEC with UA caused a dose-dependent decrease in NO and cGMP production stimulated by bradykinin or Ca(2+)-ionophore A23187. We explored cellular mechanisms by which UA might cause reduced NO production focusing on the effects of UA on the l-arginine-endothelial NO synthase (eNOS) and l-arginine-arginase pathways. Incubation of PAEC with different concentrations of UA (2.5-15 mg/dl) for 24 h did not affect l-[(3)H]arginine uptake or activity/expression of eNOS. However, PAEC incubated with UA (7.5 mg/dl; 24 h) released more urea in culture media than control PAEC, suggesting that arginase activation might be involved in the UA effect. Kinetic analysis of arginase activity in PAEC lysates and rat liver and kidney homogenates demonstrated that UA activated arginase by increasing its affinity for l-arginine. An inhibitor of arginase (S)-(2-boronoethyl)-l-cysteine prevented UA-induced reduction of A23187-stimulated cGMP production by PAEC and abolished UA-induced inhibition of acetylcholine-stimulated vasodilation in PAS. We conclude that UA-induced arginase activation is a potential mechanism for reduction of NO production in PAEC.


Figures
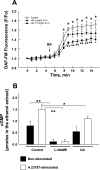
Fig. 1.
Fig. 1.
Effect of uric acid (UA) on stimulated nitric oxide (NO) production (A) and cGMP accumulation (B) in pulmonary arterial endothelial cells (PAEC). A: PAEC were incubated in the absence (control) or presence of UA (5 or 7.5 mg/dl) in culture media for 24 h. After the incubation, NO detection using a fluorescent probe 5-methylamino-2,7-difluorofluorescein (DAF-FM) was performed as described in experimental procedures. Each point represents the mean DAF-FM fluorescence ± SD at each particular time point. *P < 0.05 control vs. UA 5 mg/dl; **P < 0.05 UA 7.5 mg/dl vs. UA 5 mg/dl. B: PAEC grown in 6-well plates were incubated with 200 μM nitro-l-arginine methyl ester (l-NAME) for 1 h or 7.5 mg/dl UA for 24 h. In the end of the treatment period, the phosphodiesterase inhibitor 3-isobutyl-1-methylxanthine (0.3 mM) was added to cells and 15 min later PAEC were stimulated with A23187 (10 μM) for 10 min. In the end of the stimulation, PAEC were washed with PBS and scraped in 0.3 ml of 65% ethanol to get the ethanol extract. Extracted cGMP was determined using a cGMP detection kit. Bars are the means of 2 experiments made in duplicate. *P < 0.05; **P < 0.01.
Fig. 2.
Fig. 2.
Effects of UA on l-arginine uptake by PAEC. Cultured PAEC were incubated with different concentrations of UA dissolved in serum-free RPMI. After incubation, Na-independent l-[3H]arginine transport was assayed as described in experimental procedures. Results are the means ± SE of 3 experiments with 4 replicates in each experiment.
Fig. 3.
Fig. 3.
Effects of UA on activity and expression of endothelial NO synthase (eNOS) in PAEC. A: cultured PAEC grown in 100-mm Petri dishes were incubated with different concentrations of UA dissolved in serum-free RPMI for 24 h. After the incubation, the total membrane fraction was isolated from PAEC, and eNOS activity was determined as described in experimental procedures. B and C: Western blot analysis of eNOS contents was performed in cell lysates isolated from PAEC using anti-eNOS antibody. Western blot images from one of the experiments (B) as well as densitometric analysis of the data from all experiments (three) (means ± SE) are shown (C). The levels of eNOS expression are normalized to the actin levels in the same lysate samples. D: Western blot analysis of phopho-Ser1177-eNOS in PAEC stimulated with A23187 (10 μM). PAEC were grown on 100-mm dishes in the absence (Control, C) or presence of UA (7.5 mg/dl) for 24 h. After incubation with UA, culture medium was removed, and cells were stimulated with A23187 (A) dissolved in Hanks’ balanced salt solution for 5 min. Western blot analysis of phospho-Ser1177-eNOS and total eNOS contents was performed in cell lysates using corresponding anti-eNOS antibody.
Fig. 4.
Fig. 4.
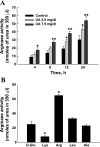
Effects of UA and amino acids on urea production by PAEC. A: effects of UA on urea production by PAEC. Culture medium (350 μl) was taken for urea measurements at 4, 8, 12, and 24 h after the beginning of incubation with UA (5.0 or 7.5 mg/dl). The values of urea contents in the culture media at 0 time points (at the beginning of cell incubation with UA) were subtracted from values determined after 4, 8, 12, or 24 h incubation. Data are from 3 experiments made in duplicates. *P < 0.05 vs. control (without UA); **P < 0.01 vs. corresponding controls and UA 5.0 mg/dl. B: PAEC were grown in 100-mm dishes in serum-free RPMI media (7 ml/dish) with addition of 10 mM d-glucose (as a control) or amino acids (10 mM l-lysine, 10 mM l-arginine, 10 mM l-leucine, or 10 mM l-alanine). After incubation for 24 h, samples of media were taken for analysis of urea contents. Data are from 2 experiments made in triplicate. *P < 0.01 vs. control.
Fig. 5.
Fig. 5.
Effects of UA on arginase expression and activity in PAEC. A: arginase II (Arg II) gene expression in PAEC measured by RT-PCR. Cultured PAEC were incubated with different concentrations of UA dissolved in serum-free RPMI for 24 h. Relative gene expression was estimated as described in experimental procedures. Data are from 2 experiments run in triplicate. B: Western blot analysis of the UA effects on Arg II protein expression. PAEC were grown in 100-mm dishes containing 10 ml of serum-free RPMI without or with UA (7.5 mg/dl) for 24 h. After incubation, PAEC were collected in lysis buffer, and Western blot analysis was performed using anti-Arg II antibody (Santa Cruz Biotechnology). Typical images from 4 independent experiments are presented. C: effect of UA on arginase activity in PAEC lysates. Arginase activity in cell lysates was determined as described in experimental procedures in the reaction media without (Control) or with UA (2.5, 5.0, or 7.5 mg/dl). Data are from 3 experiments made in duplicate. *P < 0.05. D: analysis of the Michaelis-Menten (Km) kinetics for arginase in PAEC lysates. Cell lysates were incubated with different concentrations of l-arginine in the absence (Control) or the presence of UA (7.5 mg/dl) in the incubation mixture for 1 h and then amounts of synthesized urea were measured. The parameters of maximal velocity (Vmax) and Km were evaluated using Lineweaver-Burk double-reciprocal plots. Data are from one typical experiment of 4 independent experiments are presented.
Fig. 6.
Fig. 6.
Effects of UA on arginase activity in tissue homogenates of the rat kidney and liver. Tissue homogenates of kidney (A) and liver (B) were incubated with 125 mM l-arginine in the absence (Cont) or the presence of UA (7.5 mg/dl) in the incubation mixture. After 1-h incubation, urea produced was determined. Data are from 3 experiments made in duplicate. *P < 0.05. C and D: analysis of Km kinetics for arginases in rat tissue homogenates. Tissue homogenates of rat kidney (C) and liver (D) were incubated with different concentrations of l-arginine (0.28–35.7 mM) in the absence (Control) or the presence of UA (7.5 mg/dl) for 1 h. After the incubation, urea contents were measured. The parameters of Vmax and Km were determined using Lineweaver-Burk plots and demonstrated that UA increased arginase affinity for l-arginine. Data are from one typical experiment of 3 independent experiments are presented.
Fig. 7.
Fig. 7.
Arginase inhibition prevents the UA effect on cGMP production in PAEC and on vasorelaxation of U-46619-contracted porcine PAS. A: an arginase inhibitor (S)-(2-boronoethyl)-l-cysteine (BEC) blocks UA-induced stimulation of urea production. PAEC were grown on 100-mm dishes in 7 ml of RPMI without (Control) or with an arginase inhibitor BEC (100 μM), UA (7.5 mg/dl), or UA + BEC for 24 h. At the end of the incubation period, aliquots of culture media were taken for analysis of urea contents. Data are from 3 experiments made in duplicate. B: arginase inhibitor BEC prevents the UA-induced reduction of cGMP production by PAEC. PAEC grown on 60-mm dishes were treated without (Control) or with an arginase inhibitor BEC (100 μM), UA (7.5 mg/dl), or UA + BEC for 1 h. In the end of the treatment period, the phosphodiesterase inhibitor 3-isobutyl-1-methylxanthine (0.3 mM) was added to cells and 15 min later PAEC were stimulated with A23187 (10 μM) for 15 min. In the end of the stimulation, PAEC were washed with PBS and scraped in 0.3 ml of 65% ethanol to get the ethanol extract. Contents of cGMP in 50 μl of the ethanol extract were determined using a cGMP detection kit. Bars are the means ± SE of 4 experiments made in duplicate. C: arginase inhibitor BEC prevents the UA effects on vasorelaxation of U-46619-contracted porcine PAS. PAS were washed and incubated without (Control) or with BEC (100 μM), UA (7.5 mg/dl), or UA + BEC for 1 h in Earl's buffer at 37°C for 1 h. PAS were precontracted with a thromboxane mimetic U-46619 (0.5 μM), and then the vasorelaxation responses to ACh were assessed in PAS incubated without (control) or with corresponding drugs. To standardize the data, the vascular tone of U-46619-contracted PAS was set to 0% relaxation. For each treatment, 4 separate PAS were used.

References

    1. Alderton W, Cooper C, Knowles R. Nitric oxide synthase: structure, function and inhibition. Biochem J 357: 593–615, 2001. - PMC - PubMed
    1. Aubert JD Biochemical markers in the management of pulmonary hypertension. Swiss Med Wkly 135: 43–49, 2005. - PubMed
    1. Bendayan D, Shitrit D, Ygla M, Huerta M, Fink G, Kramer M. Hyperuricemia as a prognostic factor in pulmonary arterial hypertension. Resp Med 97: 130–133, 2003. - PubMed
    1. Berkowitz D, White R, Li D, Minhas K, Cernetich A, Kim S, Burke S, Shoukas A, Nyhan D, Champion H, Hare J. Arginase reciprocally regulates nitric oxide synthase activity and contributes to endothelial dysfunction in aging blood vessels. Circulation 108: 2000–2006, 2003. - PubMed
    1. Block ER, Patel J, Sheridan N. Endotoxin protects against hyperoxic decrease in membrane fluidity in endothelial cells but not in fibroblasts. Lab Invest 54: 146–153, 1986. - PubMed

Publication types

MeSH terms

LinkOut - more resources